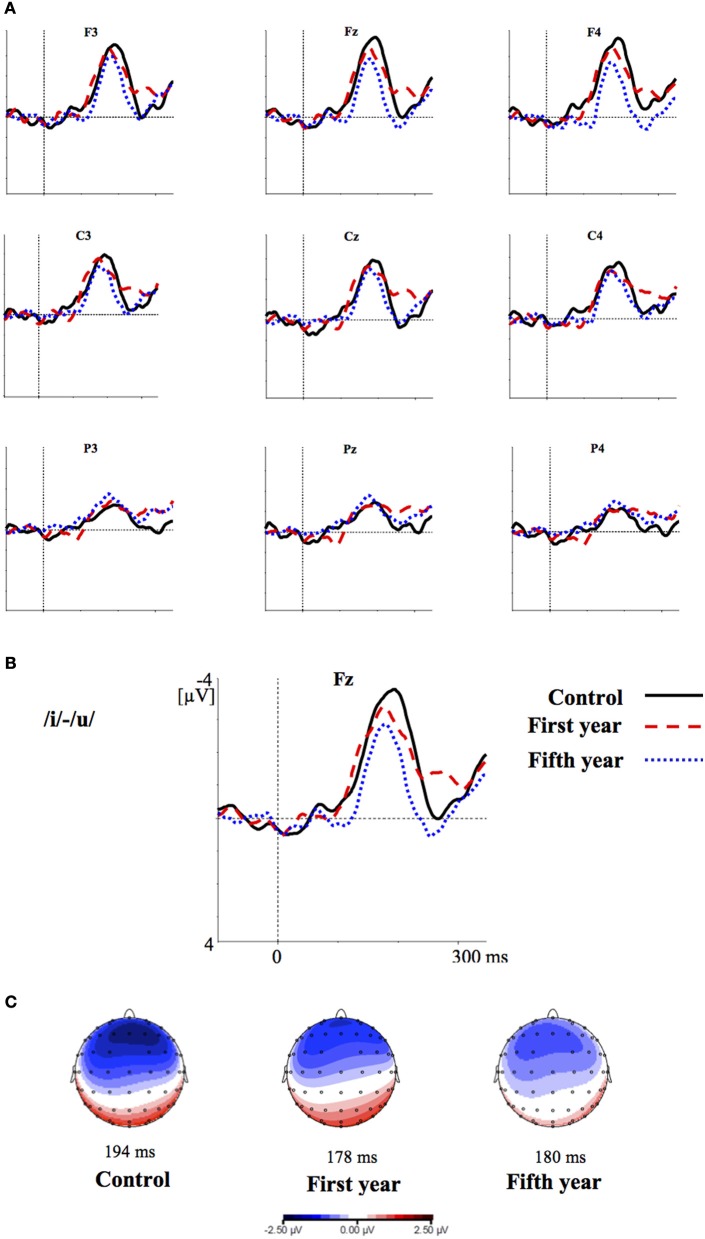
Figure 2.
(A) Grand-average difference waveforms for the first (blue pointed line) and fifth (red dashed line) year students and the control group (black solid line) in response to the contrast /i/-/u/; (B) The grand-average difference waveforms for the three groups at the frontal electrode (Fz) are enlarged; (C) Voltage maps for the groups are plotted at the MMN peaks of the grand- average waveforms, referenced to the algebraic mean of the electrodes.

