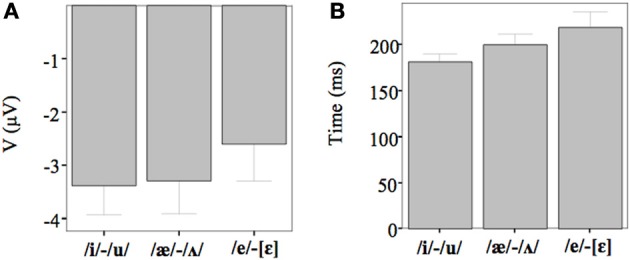
Figure 5.

(A) The average amplitude (μV) for each contrast. The results are merged since there were no significant differences among the groups. (B) The average latency (ms) for each contrast. The results are merged since there were no significant differences among the groups.
