
Figure 2.
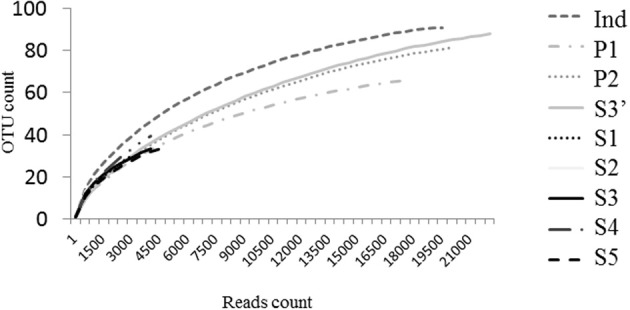
Rarefaction analysis of bacterial microbiota discovery. Operational taxonomic units (OTUs) were grouped with a 97% similarity. Rarefaction curves represent the number of new OTUs discovered by sampling without being recaught.
Official websites use .gov
A
.gov website belongs to an official
government organization in the United States.
Secure .gov websites use HTTPS
A lock (
) or https:// means you've safely
connected to the .gov website. Share sensitive
information only on official, secure websites.
Rarefaction analysis of bacterial microbiota discovery. Operational taxonomic units (OTUs) were grouped with a 97% similarity. Rarefaction curves represent the number of new OTUs discovered by sampling without being recaught.