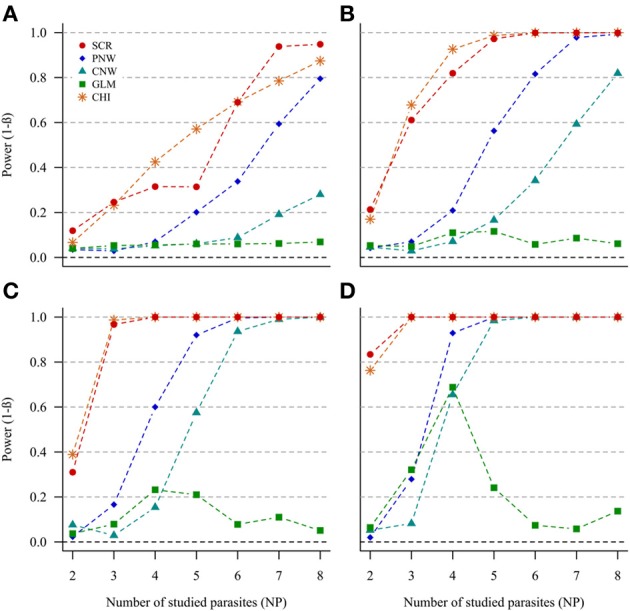
Figure 2.

Simulation outputs relative to the test of power (1-β) for the four approaches used to detect host structuring, with a prevalence ratio equal to 0.5. CHI, generalized chi-square test; PNW, parasite network model; CNW, combination network model; GLM, multinomial GLM model and SCR, the association screening approach. The number of parasites varied from two to eight, the size of the total host population was fixed to 1000 and the ratios of host subpopulation sizes varied (A) 0.2. (B) 0.3. (C) 0.4. (D) 0.5.
