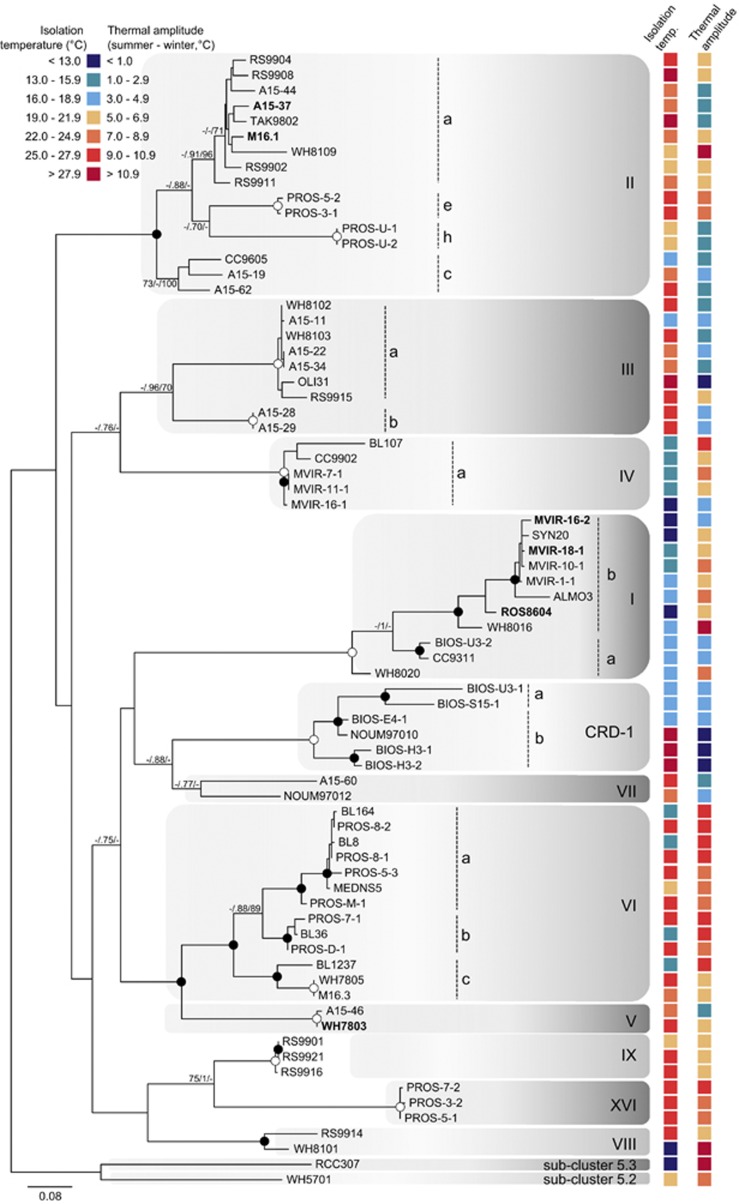
Figure 7.
Maximum likelihood (ML) analysis of the petB gene (based on 559 aligned amino acids) retrieved from 74 marine cultured isolates of Synechococcus. For each strain, sea surface temperatures at the isolation site are indicated according to the colour scale. Numbers at nodes correspond to bootstrap values from ML, posterior probability of Bayesian inference (BI; ranging between 0 and 1) and bootstraps for neighbour-joining (NJ) method. Bootstraps, represented as a percentage, were obtained through 1000 repetitions for each method, and only values higher than 70% are shown on the phylogenetic tree. Filled circles correspond to nodes supported by values higher than 70/0.8/80 for ML/BI/NJ methods, respectively. Empty circles correspond to nodes fully supported by the three methods. The six Synechococcus strains used in this study are in bold. Synechococcus sp. WH5701, affiliated to subcluster 5.2, was used as an outgroup. The nomenclature described by Mazard et al. (2012a) was retained for the clade numbers.

