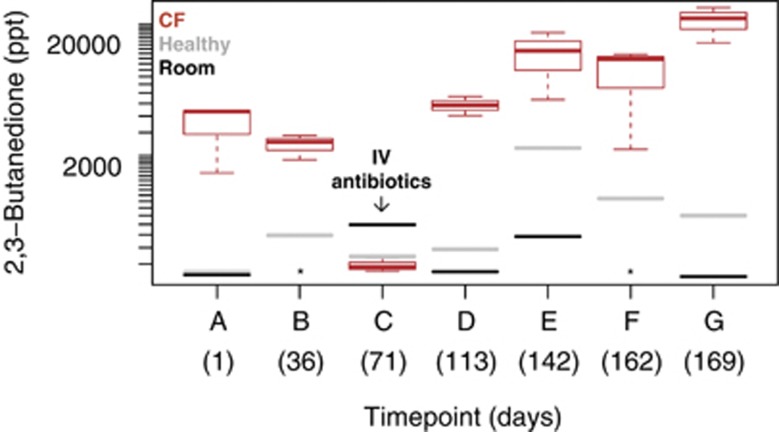
Figure 2.
Box-plot showing concentrations of 2,3-butanedione from seven time-points taken over the course of 6 months in one CF patient (red), one gender matched healthy volunteer (gray) and room air samples (black). The red boxes represent the middle 50% of the data from the three CF breath samples taken at each time-point, whereas the whiskers show the minimum and maximum values, and circles represent outliers. 2,3-butanedione levels on the y axis are plotted on a logarithmic scale. The asterisks indicate room samples with a level of 2,3-butanedione that was undetectable (the 36-day time-point), or below the range of the y axis (177ppt, 162-day time-point).

