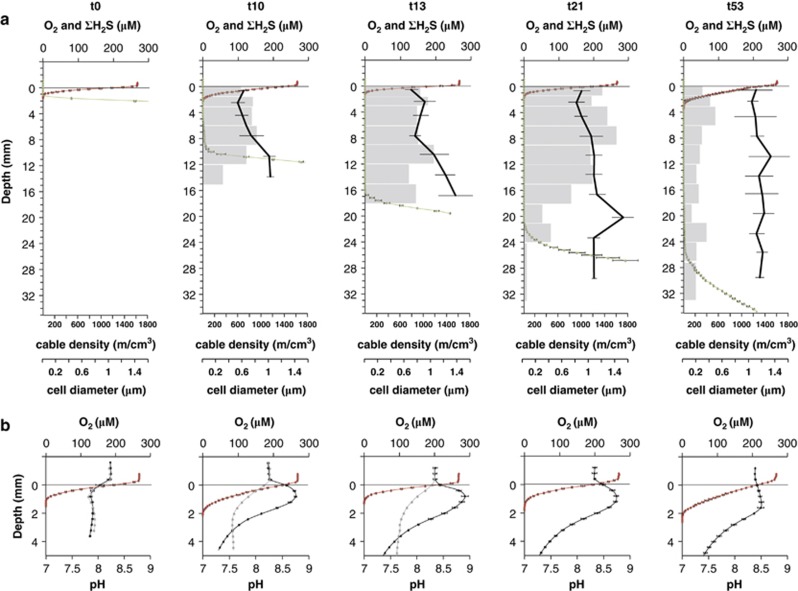
Figure 1.
(a) Depth distribution of oxygen (red), sulphide (green), cable bacteria density (grey bars) and cable bacteria diameter (black line) over time during sediment incubations. Time of incubation is given in days (t0–t53). Mean values (±s.d.; n=3) are shown for triplicate chemical profiles. Mean values of diameters (±s.d.; n=3–15) are weighted by the square and on the basis of all analysed cables for each time point and depth. (b) Close-up of the oxic zone with microprofiles of oxygen (red) and pH (black); mean±s.d. (n=3). In addition, single pH profiles (grey) are shown for control cores, from which cable bacteria growth was excluded by polycarbonate filters.

