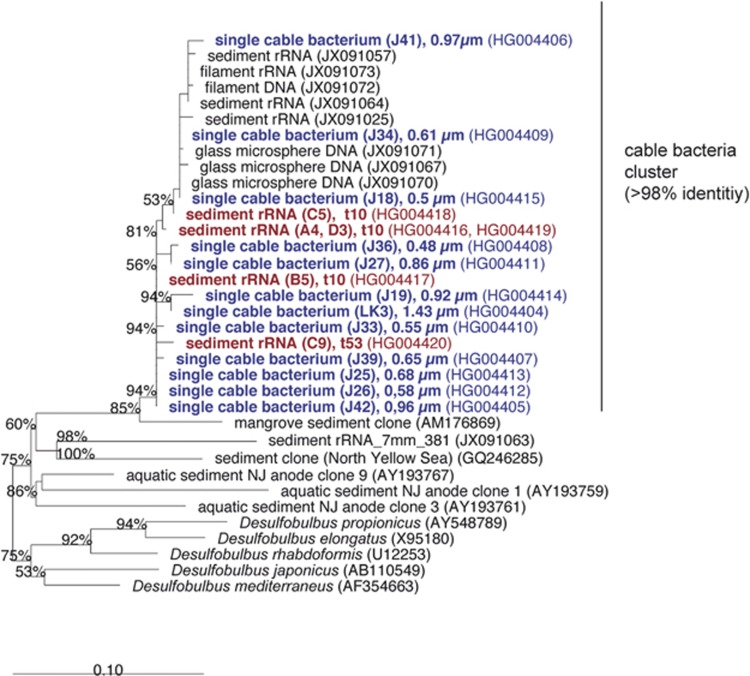
Figure 4.
Phylogenetic affiliation by maximum-likelihood of 16S rRNA sequences obtained in this study. Bootstrap support (1000 replicates) >50% is displayed at the nodes. Sequences obtained from single cable bacteria are shown in blue with their filament diameter indicated, sequences from bulk sediment rRNA are shown in red with the day of sampling indicated. Clone identifier and EMBL accession numbers are given in parentheses. The tree is rooted to Escherichia coli and Vibrio fischeri. The bar represents 10% estimated sequence difference.

