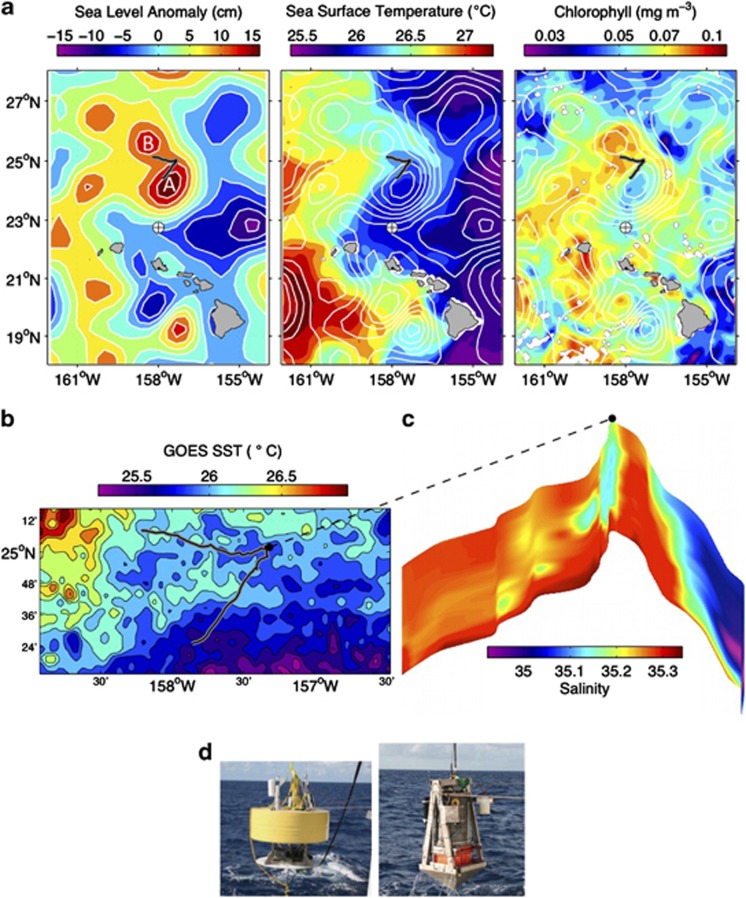
Figure 1.
BioLINCS environmental setting. (a) Sea-level anomaly (SLA: contours overlaid on all panels), sea surface temperature (SST) and near-surface chlorophyll concentrations are averages of satellite data from AVISO (Archiving, Validation and Interpretation of Satellite Oceanographic data) and MODIS (Moderate Resolution Imaging Spectroradiometer) Aqua, for 6–20 September 2011. The gray/black track shows the drift path of the instrumented platform (ESP, CTD and Acoustic Doppler Current Profiler (ADCP)), which began at the southernmost point. SLA image depicts eddies A and B, which influenced the ESP drift trajectory and are described in the text. The clockwise circulation of eddy A and associated stirring of regional water types is evident in the SST and chlorophyll patterns. Station ALOHA is marked by the circle+ symbol. (b) GOES (Geostationary Operational Environmental Satellites) SST from 12–13 September 2011 (nighttime). (c) Salinity along the ESP drift track, upper 80 m. (d) ESP drifter float (left) and base (right) are connected via an electromechanical cable. The ESP is sealed within the cylindrical pressure housing mounted to the platform base.

