Figure 4.
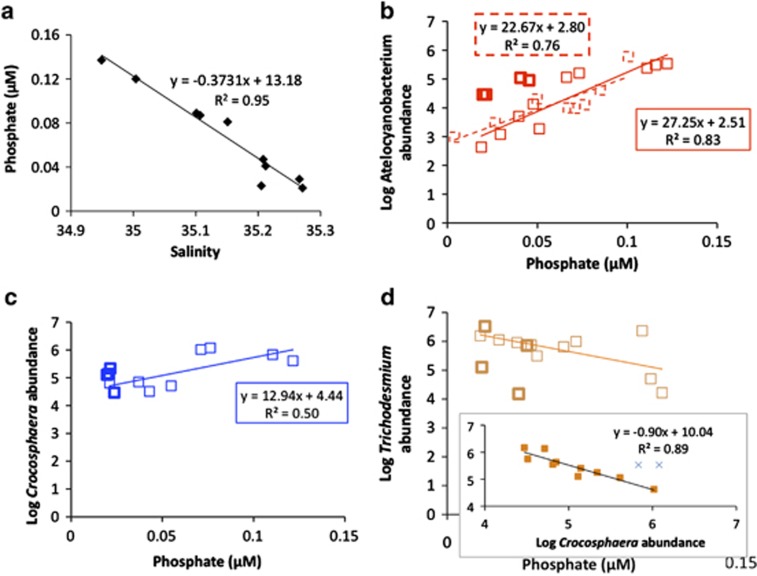
Regressions with phosphate. (a) The significant relationship between salinity and phosphate during the BioLINCS cruise allowed extrapolation of phosphate concentrations using salinity data, from ESP-collected samples. (b) Log of Atelocyanobacterium abundances versus phosphate concentrations. For remaining panels, squares correspond to BioLINCS eddy A samples, bold squares correspond with BioLINCS inter-eddy transition zone samples and dashed squares correspond with HOT data since 2008. The significant relationship between Atelocyanobacterium abundances and phosphate concentrations in the summer for all data sets since 2008 (note that here we show R2-values, whereas Pearson's correlation R-values are reported in the main text). (c) Positive relationship between the log of Crocosphaera abundances and phosphate concentrations (P=0.05). (d) Negative relationship between the log of Trichodesmium abundance versus phosphate concentration (P>0.05). Inset shows the same log of Trichodesmium abundances versus Crocosphaera abundances (R=−0.88; P<0.05); ‘X' designate the two outliers of this correlation. Abundances in the inter-eddy transition zone are elevated for the unicellular cyanobacteria, and depleted for Trichodesmium.

