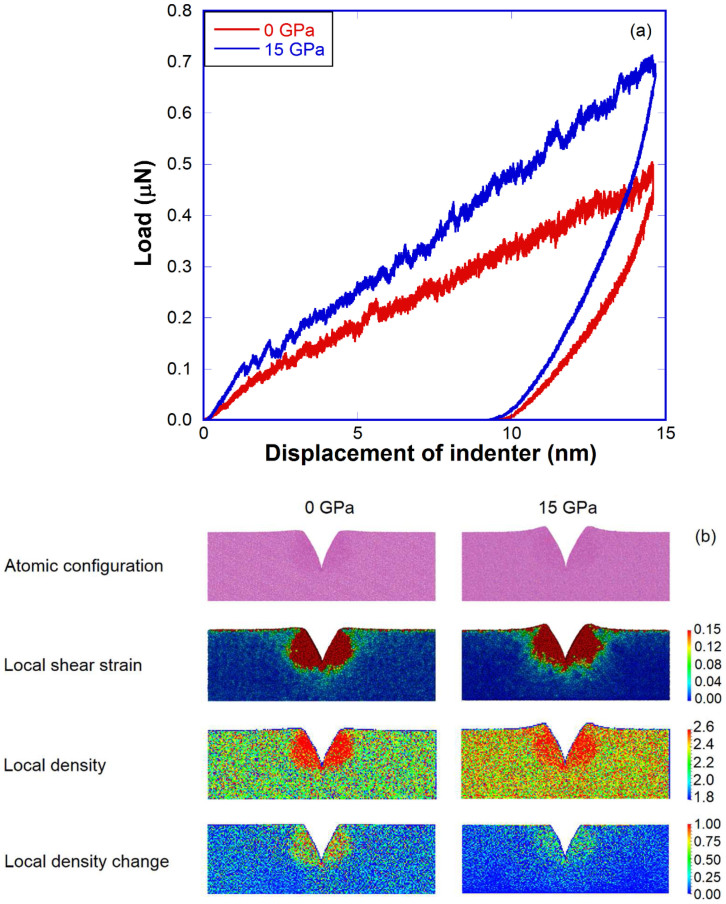
Figure 4. Deformation of pressure-quenched a-silica during nanoindentation test.
(a) Load-displacement curves of nanoindentation test for the 0 GPa and 15 GPa sample; (b) Atomic configuration (first row), local shear strain (second row), local density (third row) and local density change mapping under indenter (fourth row) after nanoindentation test for the 0 GPa and 15 GPa sample.

