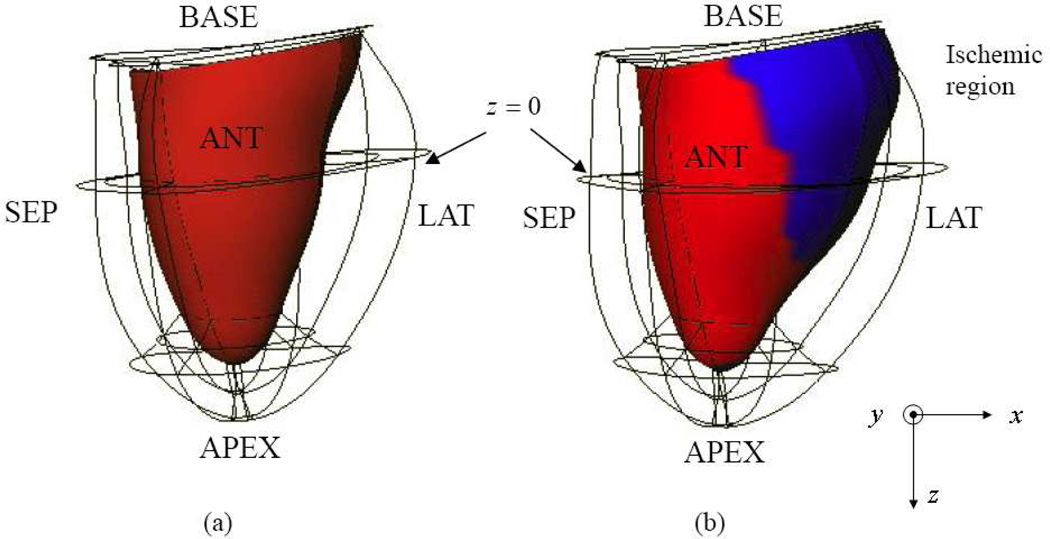
Fig. 1.
Anterior views at end-systole (ES): (a) normal and (b) left-circumflex ischemic (LCx) models shown in Cartesian coordinates (x, y, z), where x, y and z represent lateral, axial and elevational directions, respectively. Endo- and epicardium are represented by red shading and the wire frame, respectively. The ischemic region (blue shading) is located in the posterior-lateral wall.

