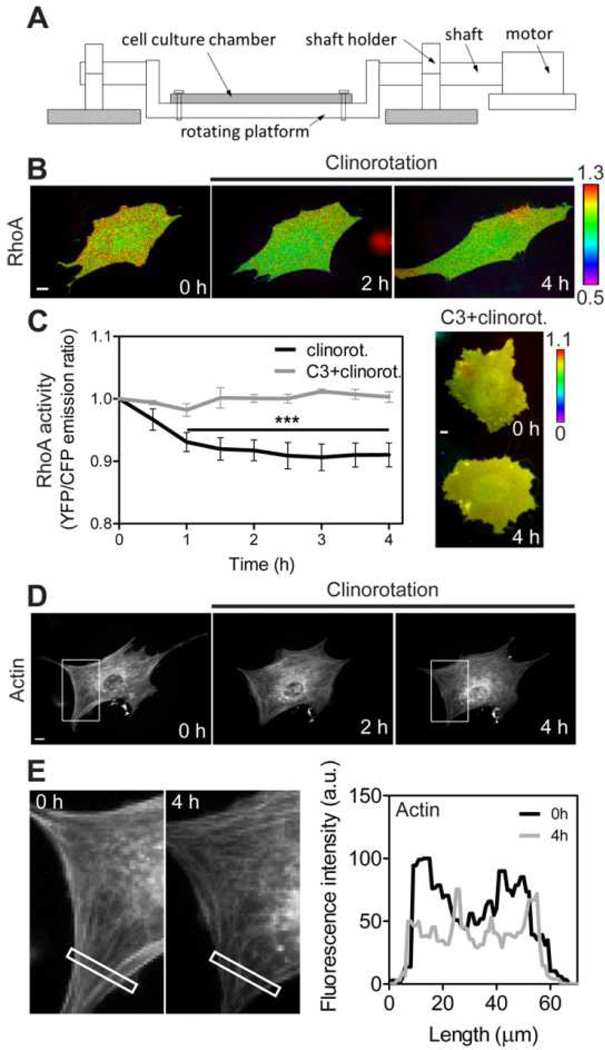
Fig. 1.
RhoA activity and actin cytoskeletal organization is downregulated under clinorotation. (A) A schematic of the custom-built clinostat. A cell culture chamber is mounted on the rotating platform. Clinorotation (simulated microgravity; 0.005 g) was achieved by using the platform with 2 cm of rotational radius (distance between the shaft and platform) and rotating the chamber at 15 rpm. (B) The FRET change of the RhoA biosensor in the representative MC3T3-E1 cell under clinorotation. The cell was transfected with a CFP-YFP RhoA biosensor. For each time-lapse imaging experiment the images from the same cell were taken. Color bar represents emission ratio of YFP/CFP of the biosensor, an index of RhoA activation. Ratio images were scaled according to the corresponding color bar. (C) The time course represents RhoA activity of MC3T3-E1 cells under clinorotation. YFP/CFP emission ratios were averaged over the whole cell and were normalized to time 0. For the statistical analysis, emission ratios were compared with those at time 0 (*** P < 0.001). n = 10 cells. Rho inhibitor (C3)-treated cells did not show any changes in RhoA activity under clinorotation. n = 8 cells. (D) In response to clinorotation, MC3T3-E1 cell displays a decrease in actin structure. Five other cells showed similar results. The white boxes are cropped and enlarged for a better visualization in (E). (E) Fluorescence intensity profile of actin along the length of the rectangle from the left to the right at 0 h and 4 h of clinorotation. Scale bars = 10µm.

