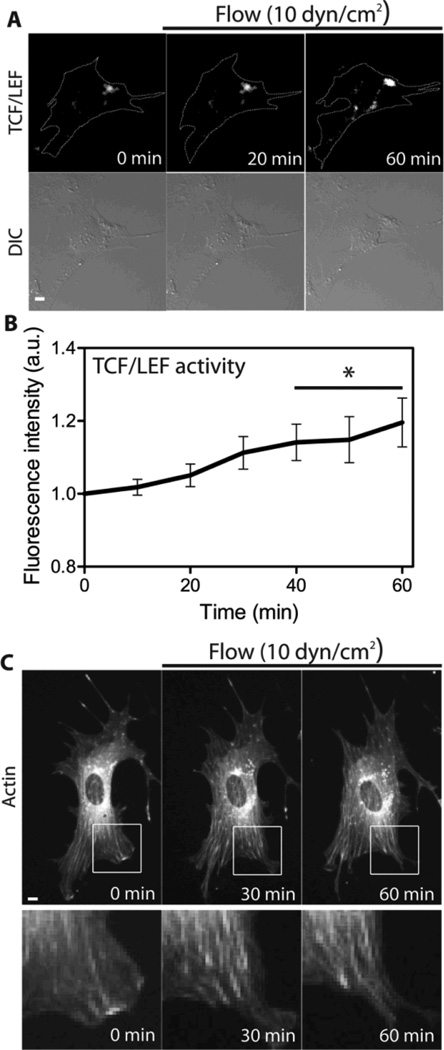
Fig. 6.
The effect of fluid flow on actin cytoskeletal organization and β-catenin signaling in MC3T3-E1 cells. (A, B) The time course of TCF/LEF activity in MC3T3-E1 cells in response to 10 dyn/cm2 of shear stress. Scale bar =10µm. n = 5 cells. Time course of TCF/LEF activity was compared with 0 min (* P < 0.05). (C) In response to shear stress at 10 dyn/cm2, the cell displays an increase in actin cytoskeleton structure. Six other cells showed similar results. The white boxes are cropped and enlarged for a better visualization. Scale bar 10µm.

