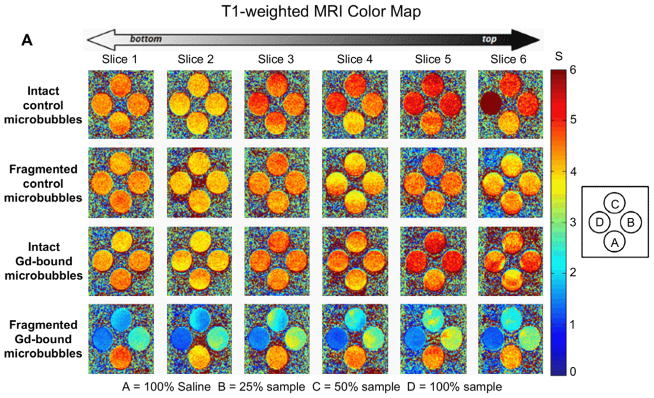
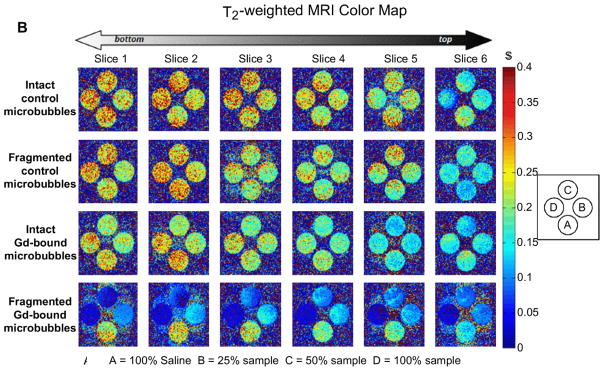
Fig. 6.


Color maps of MRI relaxation time for intact and fragmented microbubble samples. Longitudinal relaxation time (A) and transverse relaxation time (B) increases from blue to red, as shown. Samples are arranged shown: row 1) intact DOTA-bound control microbubbles; 2) fragmented DOTA-bound control microbubbles; row 3) intact Gd(III)-bound microbubbles; row 4) fragmented Gd(III)-bound microbubbles. Students’ t-tests showed that, for a given microbubble sample, T1 and T2 were not statistically different between vertical slices. (For interpretation of the references to colour in this figure legend, the reader is referred to the web version of this article.)
