
Figure 1. Comparative histology of retinas from rho- and rds-linked RP mouse models.
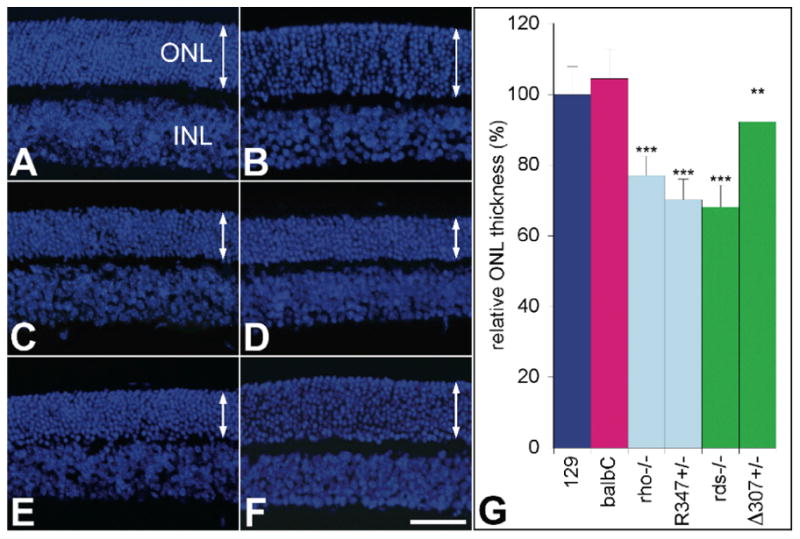
Representative microscopic images illustrate retinas of (A) 129, (B) balbC, (C) rho-/-, (D) R347+/-, (E) rds-/- and (F) Δ307+/- mice. Cell nuclei were counterstained by DAPI and outer nuclear layer (ONL) thickness was measured in microscopic images and corresponding average values plotted (G). Arrows indicate the thickness of the ONLs. INL: inner nuclear layer; scale bar represents 25 μm; **: p<0.01; ***: p<0.001.