
Figure 2. Pan-retinal miR expression signature in rho- and rds-linked RP mouse models.
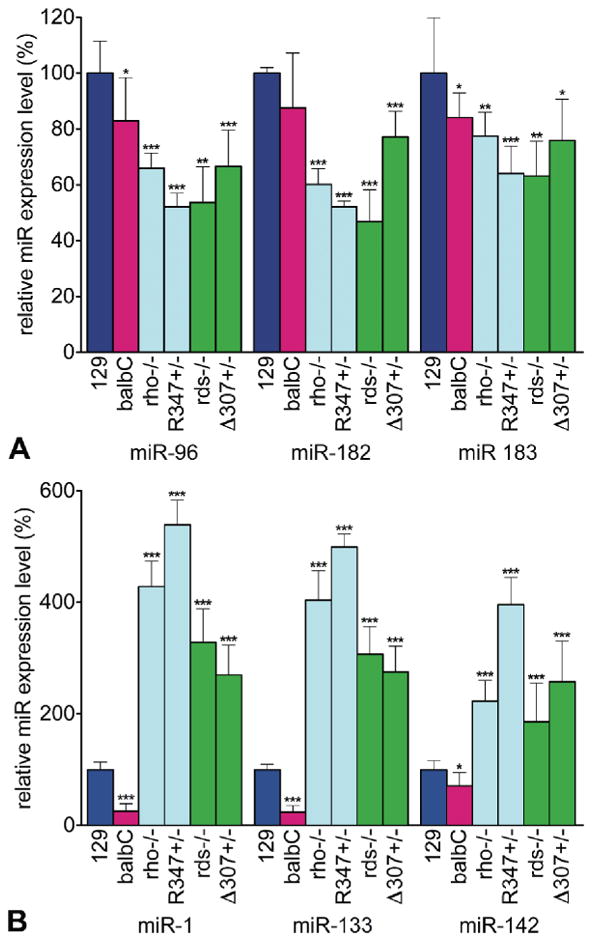
Expression levels of miR-96, -182, -183 (A) and miR-1, -133 and -142 (B) were analyzed by qRT-PCR and normalized to wild type 129 values. Note, that as rds-/- mice are on a balbC background, for p-value calculations data from rds-/- mice were compared to those from wild type balbC mice. *: p<0.05; **: p<0.01; ***: p<0.001.