
Figure 3. Histological and FACS analysis of RGFP-Δ307 and -R347 retinas.
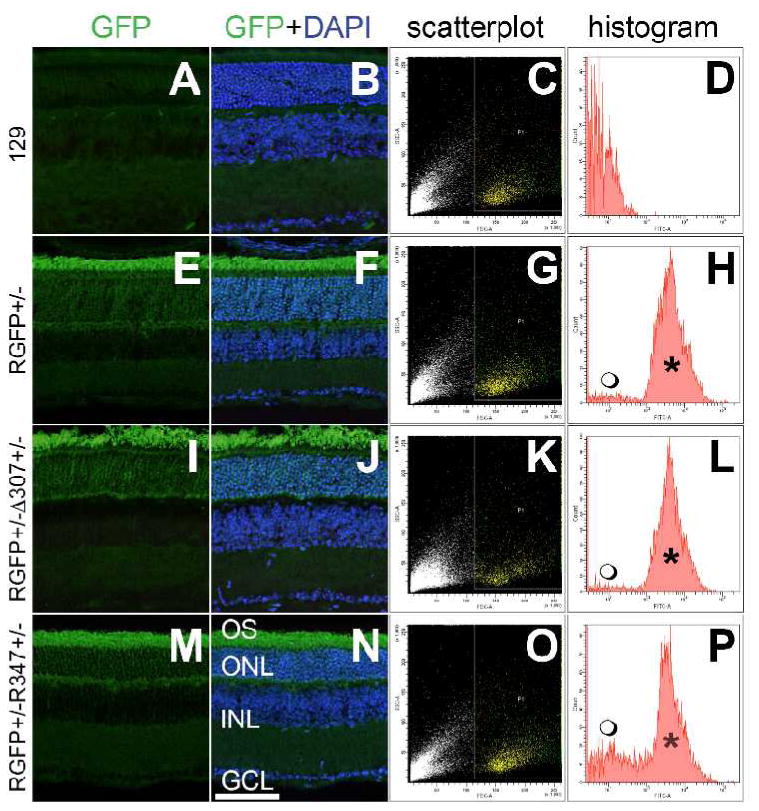
One month-old wild type 129 (A and B), RGFP+/- (E and F), RGFP+/- Δ307+/- (I and J) and RGFP+/- R347+/- retinas were analyzed for GFP fluorescence; cell nuclei were counterstained with DAPI. Retinas from the above mice were dissociated with trypsin and analyzed by FACS. Forward- versus side-scatter plots of retinal cells are depicted on C, G, K and O; yellow dots represent the gated populations. GFP fluorescence histograms of the gated populations are given in D, H, L and P; GFP-positive peaks are marked by *. Also note the GFP-negative populations (
 ), which correspond to non-rod cells in the dissociated retinas on the RGFP background (H, L and P). INL: inner nuclear layer; GCL: ganglion cell layer. Scale bar represents 25 μm.