
Figure 5.
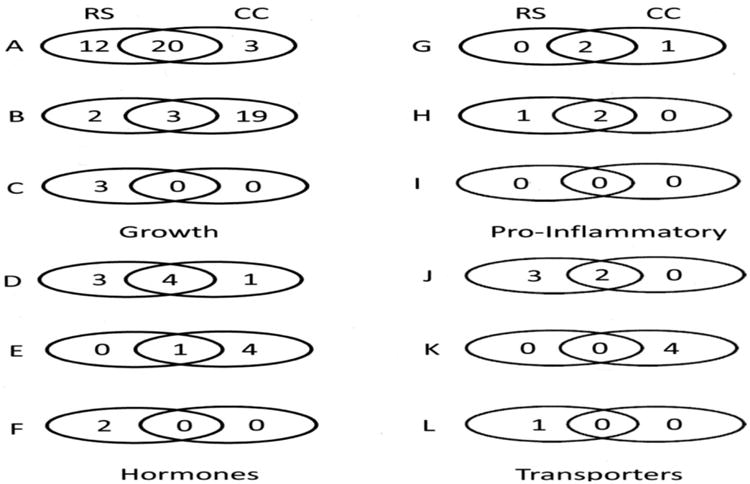
Venn diagrams comparing RS and CC gene expression grouped according to four broad categories of function. The figure compares RS vs. EC with RS vs. EC for similarities and differences in numbers of genes that were either up-regulated (A, D, G, J), not different (B, E, H, K), or down- regulated (C, F, I, L). The four broad categories are 1. growth and differentiation, regulators of cell cycle, and angiogenesis; 2. Hormones and secretory proteins; 3. pro-inflammatory; and 4. Transporters.