
Figure 6.
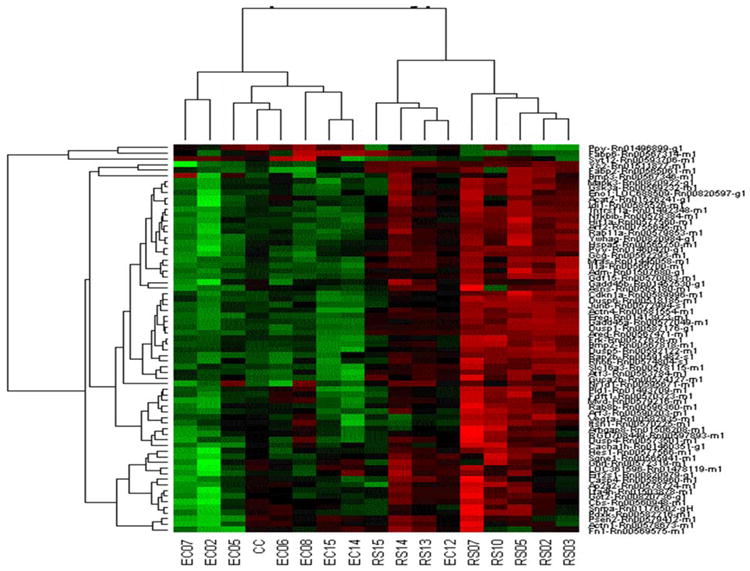
A hierarchical cluster of the Z scores of the antilogs of the 2-ΔΔCT of RS vs. EC from the TaqMan Custom Array panel results from the validation. The Z-scores were determined by calculating the three groups combined mean for each gene, and then individual differences of treatment replicates from the mean were divided by the standard deviation. This is one type of normalization for making gene-gene comparisons. Different genes are shown in each separate row. The columns are individual replicates of treatments and from left to right they are: EC7, EC12, EC5, mean of CC group, EC6, EC8, EC15, EC14, RS15, RS14, RS13, EC12, RS7, RS10, RS5, RS2, RS3.