
Figure 7.
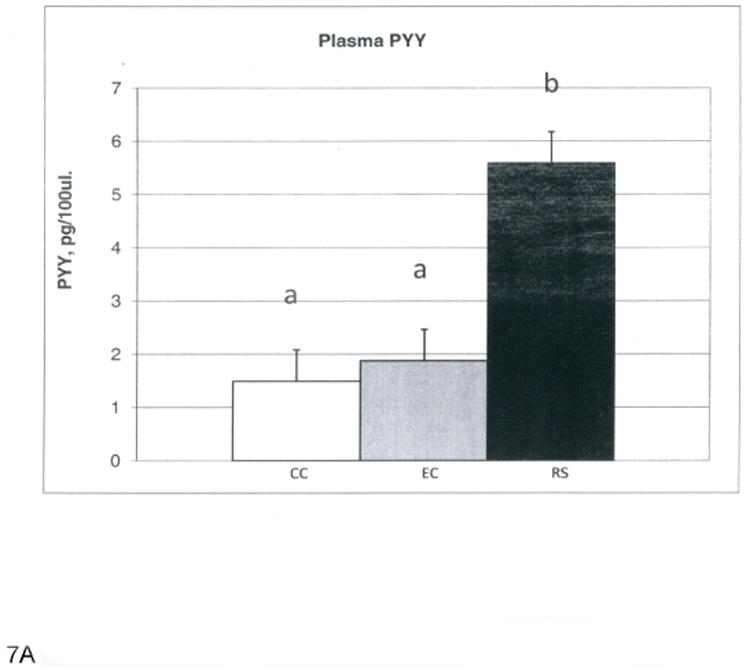
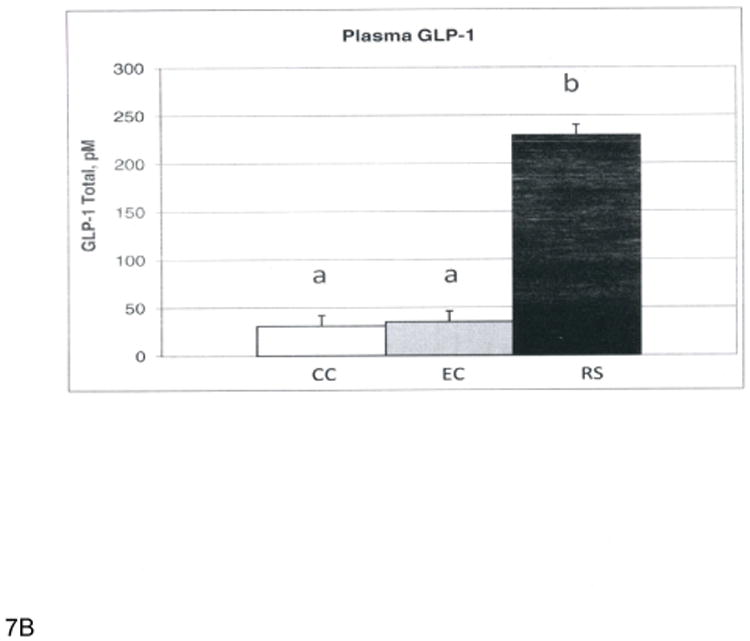
A. Plasma PYY levels (pg/100μl). B. Plasma GLP-1 levels (pM). Bars with different superscripts are statistically different at p<0.0001.
Official websites use .gov
A
.gov website belongs to an official
government organization in the United States.
Secure .gov websites use HTTPS
A lock (
) or https:// means you've safely
connected to the .gov website. Share sensitive
information only on official, secure websites.
A. Plasma PYY levels (pg/100μl). B. Plasma GLP-1 levels (pM). Bars with different superscripts are statistically different at p<0.0001.