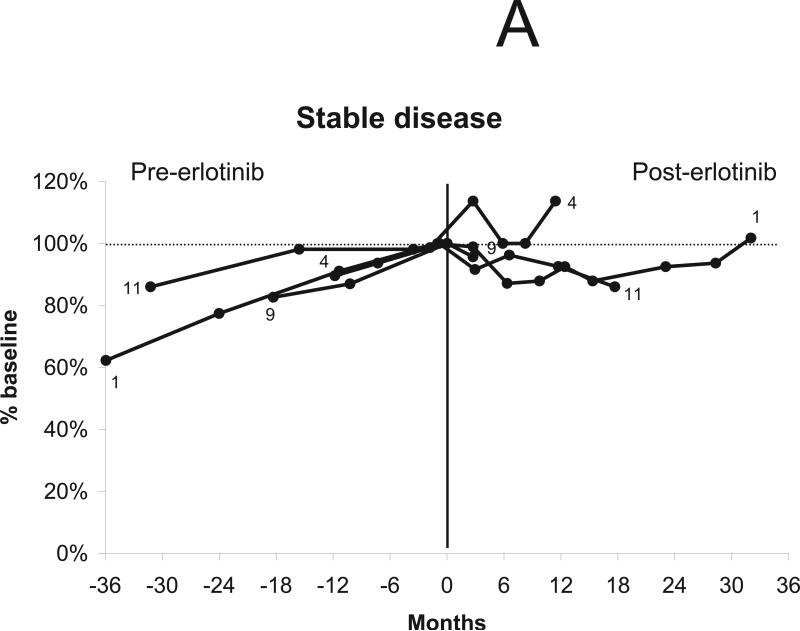
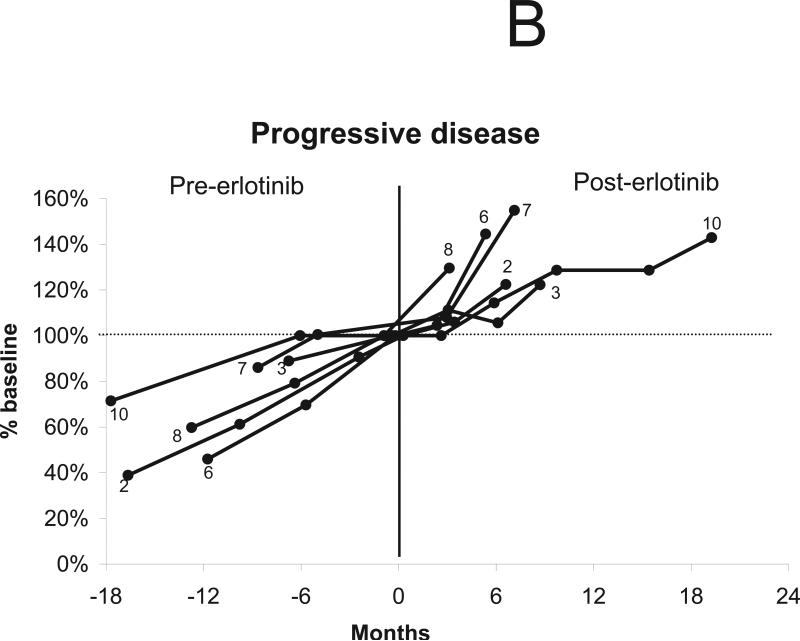
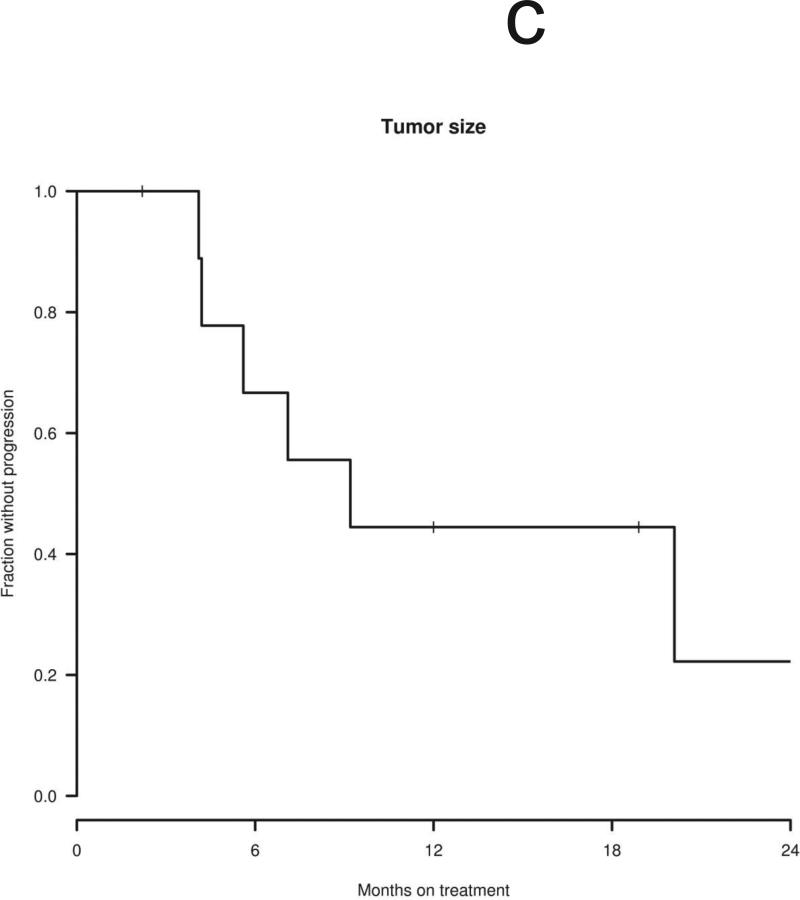
Figure 1.
Changes in tumor volume after treatment using erlotinib 150 mg daily. “0” indicates initiation of treatment. The vertical line indicates the start of treatment (day 0). (a) Four tumors were stable during treatment, defined as change in tumor volume between 19% growth and 19% shrinkage compared to the baseline volume. (b) Six tumors progressed during treatment, defined as an increase in tumor volume of greater than or equal to 20% compared to the baseline volume. (c) Time to tumor progression in 10 evaluable patients.


