
Figure 3.
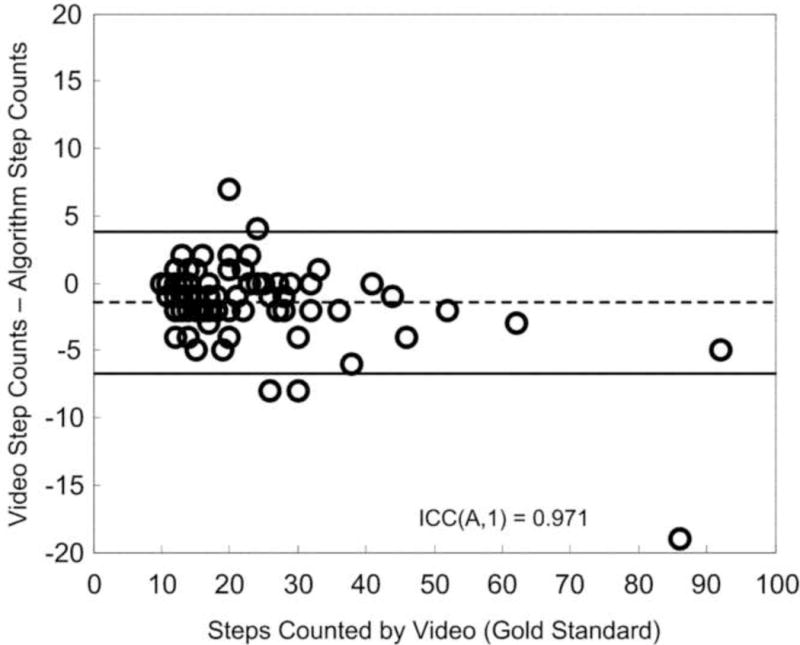
Bland Altman plot demonstrating the difference between the activity monitoring system algorithm and visual step counts as the number of steps taken changes (as a result of changes in gait velocity). The dashed line is the mean, while the solid lines represent the repeatability coefficient (± 1.96 SD).