
Figure 5.
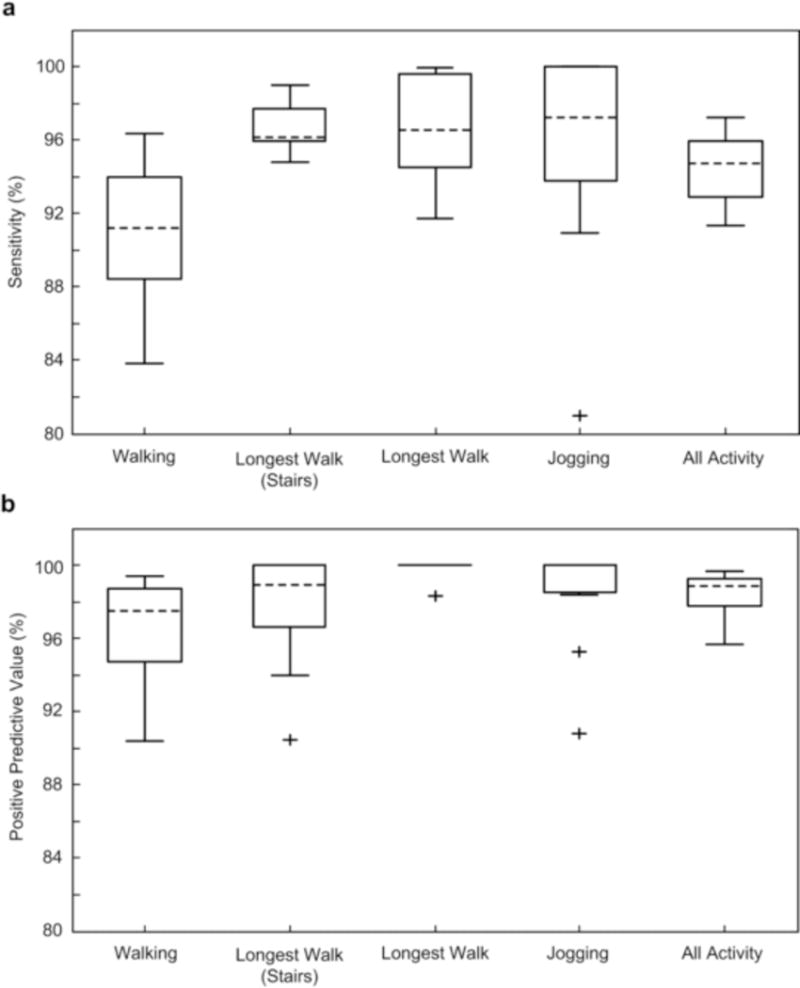
Step detection sensitivity (A) and positive predictive value (B) when identifying all walking steps, walking steps during the longest activity segment which includes stair climbing, walking steps during the longest activity segment on flat ground only, jogging steps, and the total number of steps compared to video identification. The central line represents the median, the edges of the box are the 25th and 75th percentiles, and the whiskers extend to ± 1.5 of the interquartile range. Outliers beyond this range are labeled as +. For the PPV of jogging, the median value is equal to 100%. For the PPV of the longest walking segment on level ground, the median value, the 25th and 75th percentiles are equal to 100%.