
Figure 6.
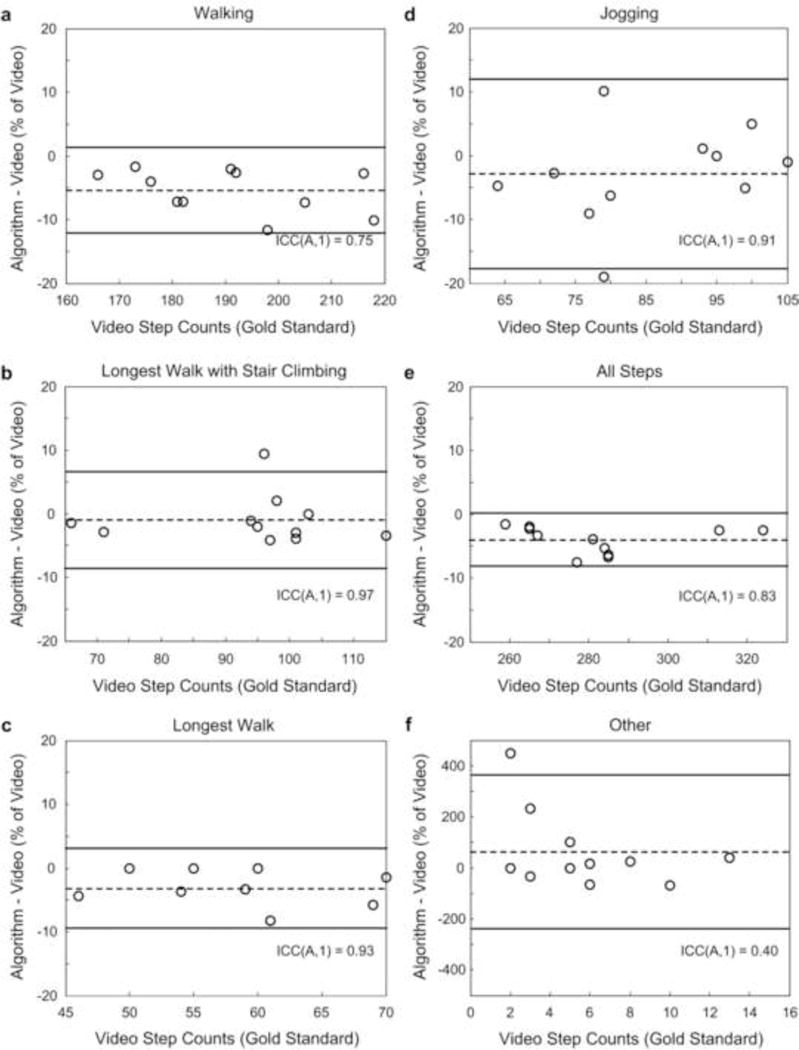
Bland-Altman plots demonstrating percentage difference for step detection when using activity monitoring system algorithm and video identifications for (a) walking, (b) walking during the longest activity segment including stair climbing, (c) walking during the longest activity segment on level ground only, (d) jogging, (e) the entire protocol, and (f) all steps classified as ‘Other’. The dashed line represents the mean, while the solid lines represent the repeatability coefficients (± 1.96 SD). ICC(A,1) values are also presented.