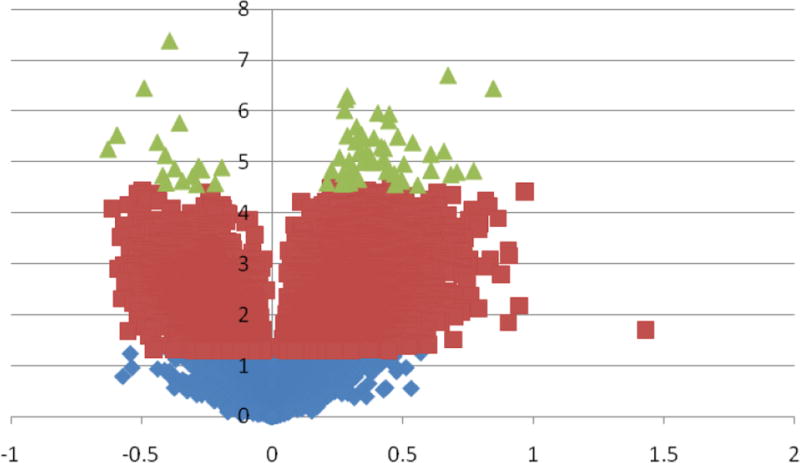
Figure 1. Volcano Plot of gene expression differences.

Distribution of Students’ T-test p-value (Y-axis: −Log10 [p-value]) and fold change (X-axis: Log2 [absolute fold change]) results comparing early pregnancy whole blood gene expressions of participants with low vitamin D concentrations (<25ng/ml) compared with those with high vitamin D concentrations (≥31.7ng/ml). The volcano plot indicates signal in the data as there were more genes with extreme p-values than would have been expected by chance. For example, there were 70 genes (green) with p-values more extreme than 0.000032 (−Log10 [p-value]=4.49) that corresponds to a conservative false discovery rate of 1/30968 (−Log10 [1/30968]=4.49). Purple genes are genes with t-test p-values > 0.000032 but less than < 0.05 and Blue genes are genes with t-test p-values >0.05.
