
Figure 2. Venn diagram summary of distribution of differentially expressed genes.
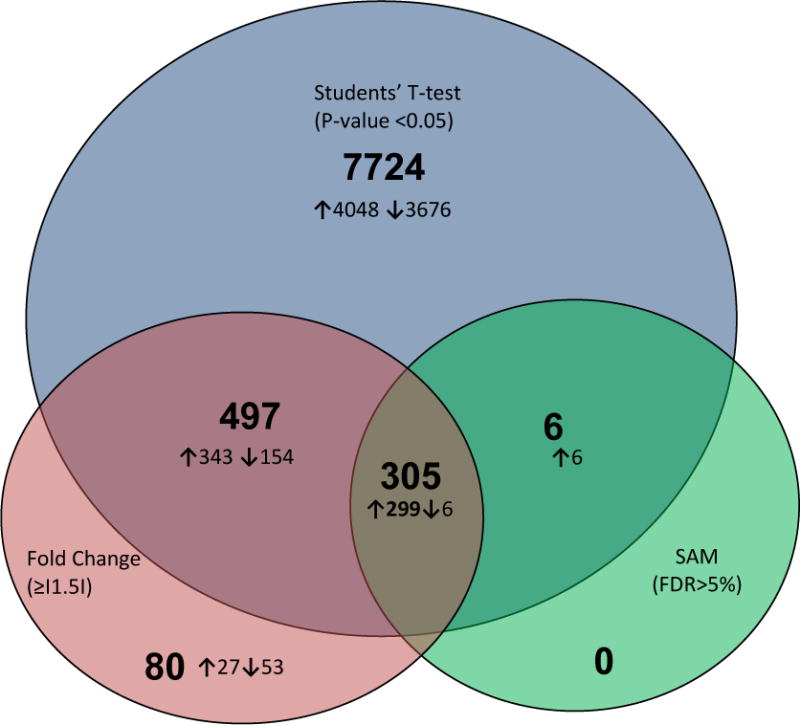
Circles represent numbers of differentially expressed genes in whole blood among pregnant women with low vitamin D concentrations (<25ng/ml) compared with pregnant women with high vitamin D concentrations (≥31.7ng/ml) in Students’ t-test (p-value < 0.05) (blue), fold change (absolute fold change ≥ 1.5) (purple) and Significance Analysis of Microarray (SAM, false discovery rate < 5%) (green) comparisons. Numbers within circles represent total number of genes and numbers of either up-regulated (↑) or down-regulated (↓) genes. The intersections of the circles represent numbers of genes differentially expressed using two or greater than two criteria as defined above.