
Figure 1.
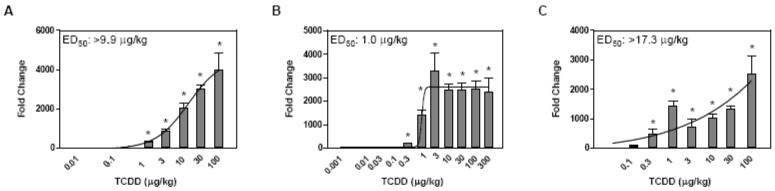
Manual QRTPCR evaluation of Cyp1a1 dose-responsiveness at 4 (A), 24 (B) and 72 (C) hrs after exposure to TCDD. The x-axis indicates the dose of TCDD, the y-axis represents the fold change calculated relative to vehicle controls. Curves were generated in GraphPad Prism 4.0 using non-linear regression; ED50 values were calculated using an automated dose-response modeler (Burgoon and Zacharewski, 2008). The asterisk (*) indicates significant fold induction by TCDD relative to vehicle controls at p < 0.05