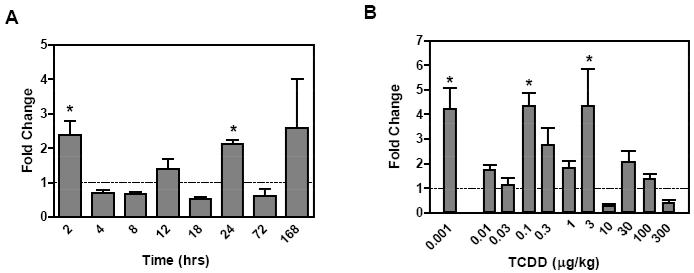
Figure 3.
Evaluation of Ndufa11, an ETC complex I gene. HTP-QRTPCR temporal expression profile (A) and dose-response (B) evaluation at 24 hrs by manual QRTPCR. The x-axis indicates the time or dose of TCDD, respectively, while the y-axis represents the fold change calculated relative to time-matched vehicle controls (n=4). The asterisk (*) indicates significant fold induction by TCDD relative to vehicle controls at p < 0.05

