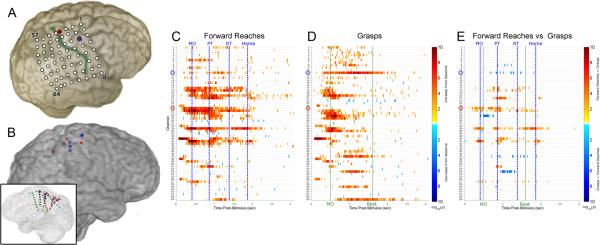
Fig. 1.

Functional mapping of cue-averaged task-related high gamma activity in training set. (A) Reconstruction of the implanted grid location for Subject 1 is depicted; the electrode used for reaching (number 25) is highlighted in red and corresponds to the channel circled in red in the activation maps below, while the electrode used for grasping (number 11) is highlighted in blue and similarly corresponds to the electrode circled in blue below; the central sulcus is highlighted in green. (B) Reconstruction of the depth electrodes implanted in right hemisphere of Subject 2; electrodes used for reaching highlighted in red, electrodes used for grasping highlighted in blue (transparent medial view in inset). (C, D) Each task map displays the spatiotemporal distribution of significant increases (red spectrum) or decreases (blue spectrum) in high gamma energy relative to precue baseline in 16 ms windows for Subject 1. Each row corresponds to a different iEEG electrode in the frontoparietal grid displayed in (A). All times are relative to cue onset. (E) A differential map is shown for Subject 1, which is the result of a Wilcoxon test between two conditions for each (channel, time) pair with FDR correction for comparisons across multiple time points within each channel. Channel and time pairs are in the red spectrum if forward reach is more activated than grasp, and in the blue spectrum if grasp is more activated than forward reach. The average times of relevant behavioral events are marked with vertical lines and labeled (movement onset, MO; pressed target button, PT; released target button, RT; returned arm to home position, Home; released pressure bulb, Rest).
