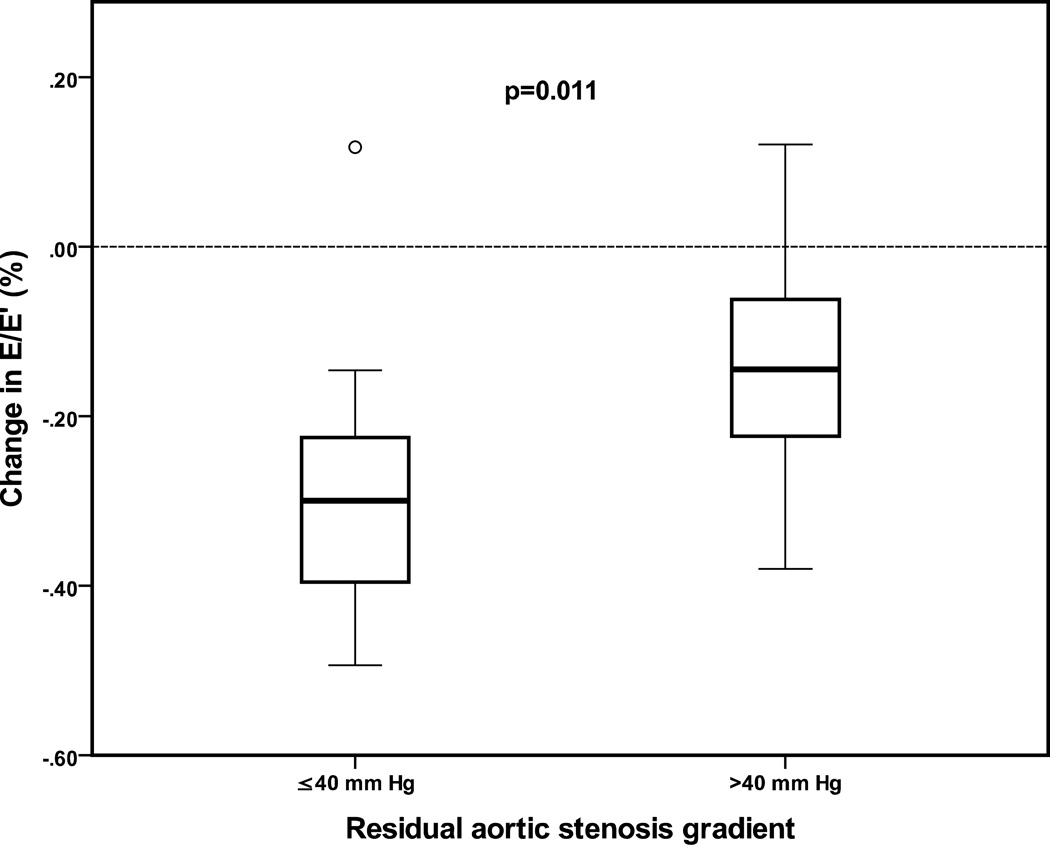
Figure 4.
Box plot showing percentage change in early diastolic pulsed-Doppler mitral inflow (E)/early diastolic tissue Doppler velocity (E') from pre-to post-balloon aortic valvuloplasty echocardiograms comparing patients with residual aortic stenosis gradient on follow up echocardiogram ≤ 40 mm Hg to patients with residual AS gradient > 40 mm Hg. Boxes represent interquartile range, dark line represents median value, and whiskers represent range.

