
FIG 2 .
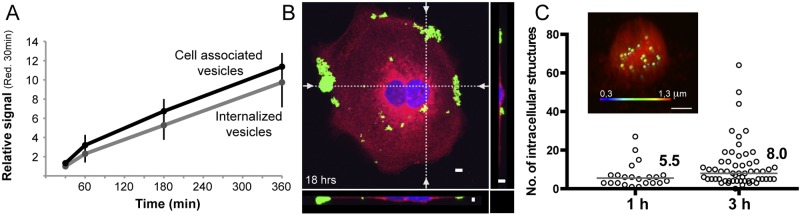
Uptake of H. pylori vesicles increases over time. (A) Vesicle internalization and vesicles associated with cells (both bound and internalized vesicles) were analyzed at 30 min, 1 h, 3 h, and 6 h with the qIS assay. All values are related to the signal seen at 30 min after exposure to the reducing agent (n = 3). (B) 3D confocal fluorescent micrographs of H. pylori vesicles incubated with AGS cells for 18 h. Vesicles were detected with Strp-FITC (green) and found to be aggregated to the edges and surfaces of AGS cells. The cell plasma membrane was stained with CellMask (red), and the nuclei were stained with DAPI (blue). The dotted lines in the merged 3D confocal micrograph indicate the optical sections (z plane) that are visualized at the bottom and to the right. Scale bar = 5 µm. (C) Calculation of the average number of vesicles per cell. 3D micrographs of intracellular vesicles at 1 and 3 h (under reducing conditions) were analyzed with Imaris software, and the number of vesicles per cell is displayed. At 1 h, the median was 5.5 vesicles/cell for 22 cells analyzed, and at 3 h, the median was 8.0 vesicles/cell for 57 cells analyzed. P was 0.0194. (Inset) 3D confocal micrograph of a cell analyzed with Imaris software. The fluorescent vesicles of different sizes are displayed in different colors (blue = 0.3 µm; red = 1.3 µm).