
FIG 2 .
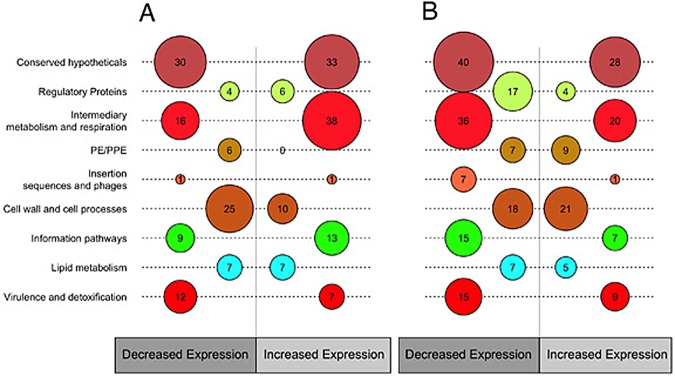
Genes differentially expressed in the fatty acid model. Numbers of genes differentially expressed by functional categories according to TubercuList (http://www.tuberculist.epfl.ch/) are shown. Circle sizes correspond to the numbers of genes with significant differential expression in fatty acid medium versus dextrose medium. (A) Exponential phase. (B) Stationary phase.