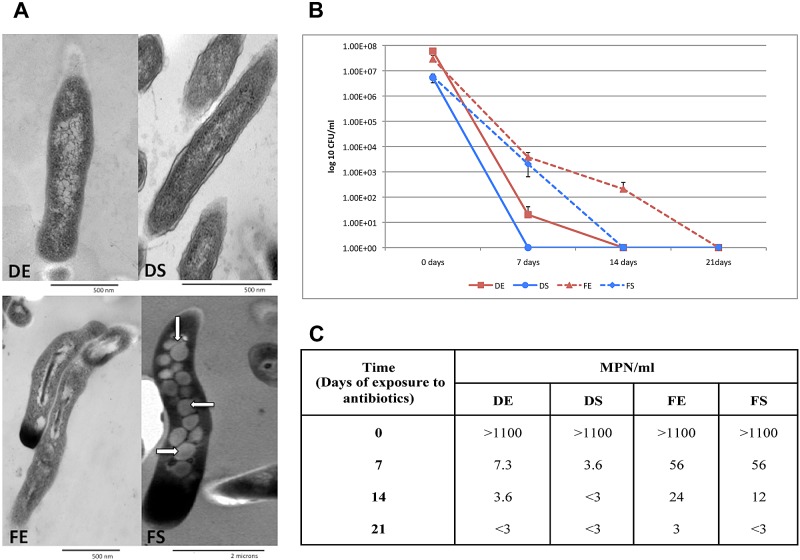
FIG 3 .
Dormancy-related phenotype of M. tuberculosis grown in the fatty-acid model. (A) Electron micrographs of M. tuberculosis grown under different carbon sources. White arrows indicate presumed lipid bodies identified in LC-FA at stationary phase. Magnification: ×60,000 (DE, DS, and FE) or ×12,000 (FS). Exponential- and stationary-phase cultures were incubated with drugs in the presence of dextrose or fatty acids. Cultures were collected after 7, 14, or 21 days of exposure to drugs as estimated by CFU counting (B) or by calculating the MPN/ml (C) (see Materials and Methods for details). The R, MX, MZ, and AK concentrations used were 8, 4, 8, and 8 µg/ml, respectively. Means and standard deviations of four experiments are shown.

