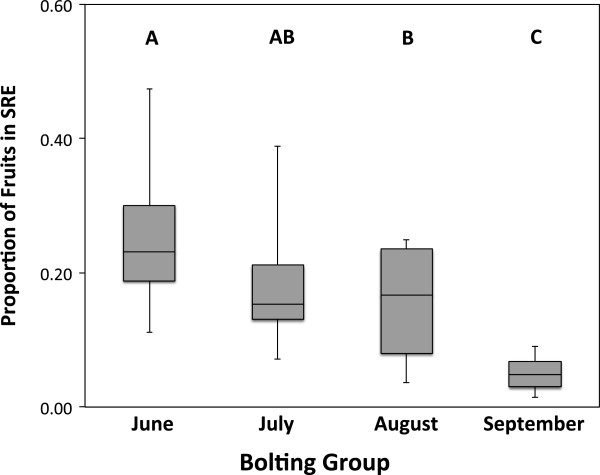
Figure 2.
Proportion of fruit allocated to SRE across the four experimental bolting groups. Boxes indicate 2nd/3rd data quartiles, horizontal lines show median value and whiskers show range of data dispersal. Levels not sharing letters indicate significantly different means by Tukey HSD test following a factorial ANCOVA performed for illustrative purposes.

