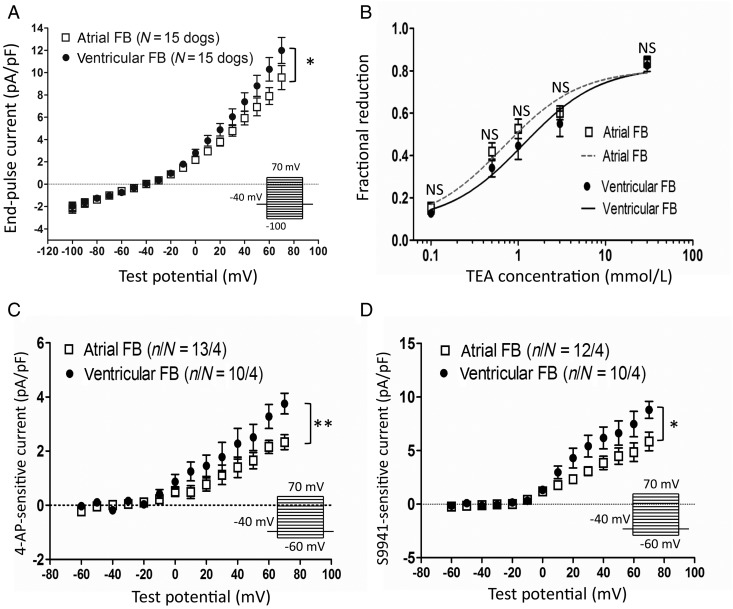
Figure 2.
Baseline current densities and TEA response of control atrial and ventricular fibroblasts (FBs). (A) Current–density voltage relationships of atrial and ventricular FBs. The voltage-clamp protocol delivered at 0.1 Hz is shown in the inset. Dog-based current densities, obtained with the use of per-dog LA and LV values (results shown are from 50 atrial cells from 15 control dogs and 46 ventricular cells from the same dogs). (B) FBs were treated with different TEA concentrations, and the effect of TEA on total end-pulse current at +60 mV was expressed as a fractional reduction: (IBL−ITEA)/IBL, where IBL, ITEA, current under baseline, and TEA conditions, respectively. The calculated IC50 of TEA was 0.68 mmol/L for atrial and 1.15 mmol/L for ventricular FBs. (C) 4-AP- (300 µmol/L) and (D) S9947- (1 µmol/L) sensitive current densities for control LA and LV FBs. *P < 0.05, **P < 0.01 for atrial vs. ventricular FBs by two-way ANOVA. n/N, number of cells/number of dogs.

