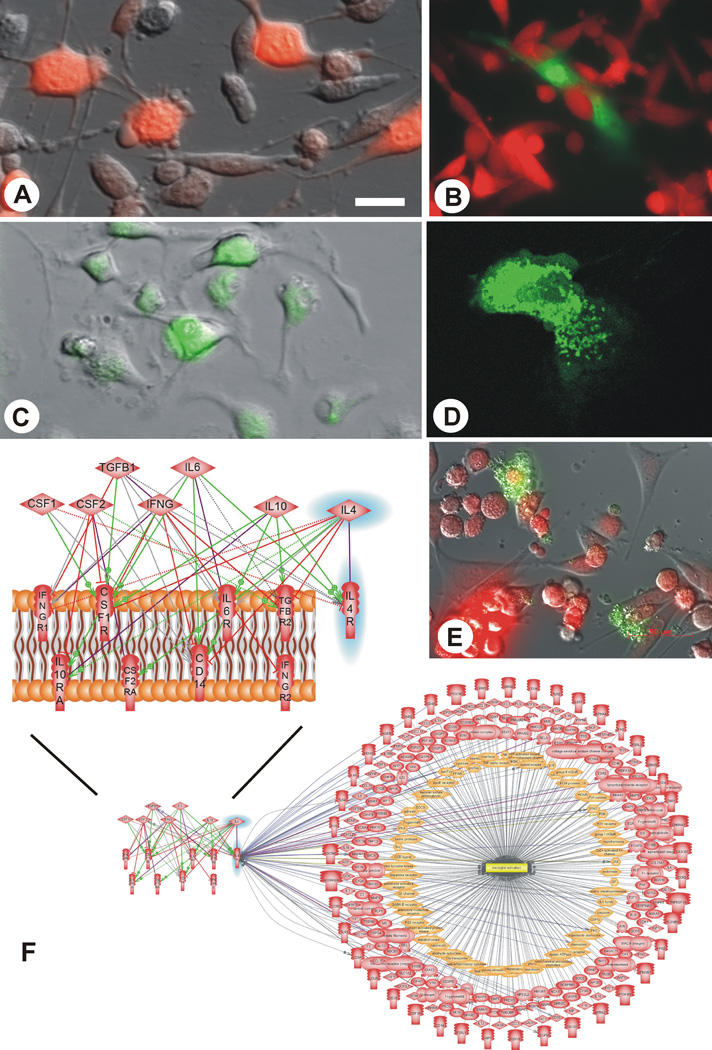
Fig. (1).
Experimental tools used in the project. A. mCherry labeled CNS-1 glioma cells in culture; B. transgenic astrocytes (green, obtained from GFP-transgenic Lewis rats) being overrun in culture by syngeneic mCherry labeled CNS-1 glioma cells (red) mirroring the in vivo situation; C. bone marrow cells isolated from GFP-transgenic Lewis rats in culture; D. a GFP-transgenic microglial cell/macrophage in culture; E. Co-culture of mCherry labeled CNS-1 glioma cells and microglia isolated from GFP transgenic rats; F. schematic representation of intercellular microglia “polarization signaling”: CSF2 (GM-CSF) and IFNG are the molecules that drive microglia towards the M1 phenotype, whereas TGFB1, CSF1, IL10, IL4 and IL6 are molecules that polarize microglia towards the M2 phenotype when binding to their respective receptors located on the surface of microglia (purple lines); however, these signals may also act on other receptors on the surface of the microglia; stimulatory regulation is represented by green lines, inhibitory regulation by red lines, and ambiguous effects are shown as grey lines; IL-4 and its receptor, IL-4R are highlighted in blue; the biological associations of the latter with molecules that are regulated during microglial activation are illustrated by the lower panel of this figure and referenced in detail in Table 2. Scale bar: 40 µm (appx. 80 in E).

