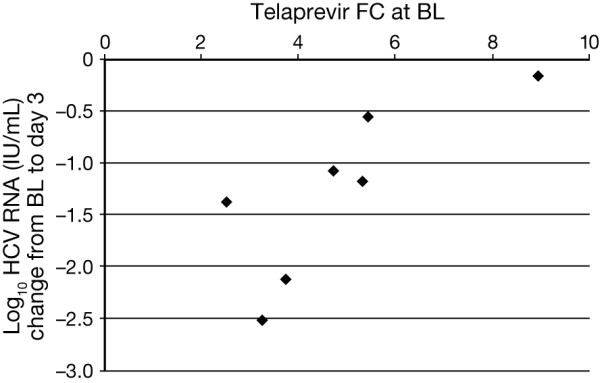
Figure 1.

Scatter plot showing baseline telaprevir susceptibility versus change in HCV RNA from baseline to Day 3 in patients treated with telaprevir monotherapy. HCV RNA, hepatitis C virus ribonucleic acid; BL, baseline; FC, fold change in IC50 value compared to IC50 from wild-type (con 1b); IC50, 50% inhibiting concentration.
