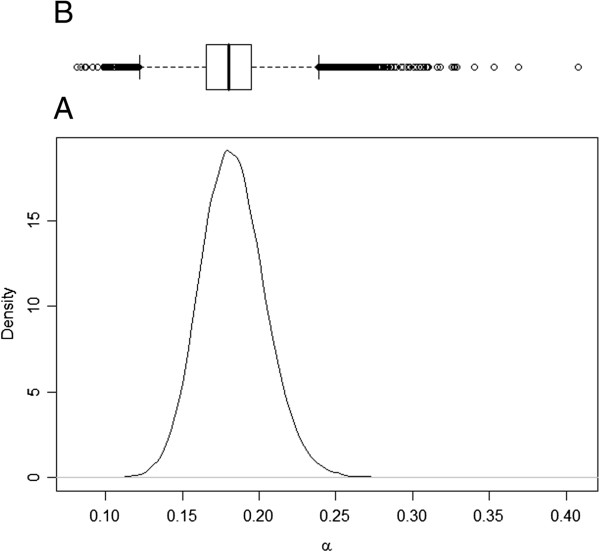
Figure 2.
Posterior distribution of α. Legend: A) Plot of the posterior distribution for transmission parameter α, which describes the rate of spread of Salmonella Typhimurium from infectious to resistant animals; B) Boxplot of the posterior samples used to produce the plot where the thick line in the box reflects the median.

