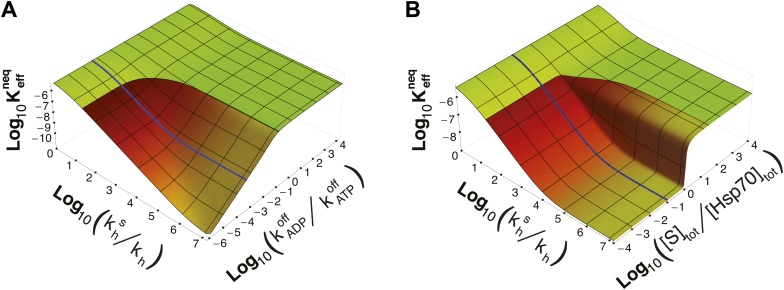
Figure 3. Dependence of on time-scale separation and on stoichiometric ratio.
(A) Non-equilibrium dissociation constant as a function of the hydrolysis acceleration ratio and of the time-scale separation between the ATP- and ADP-state, expressed as the ratio between the substrate unbinding rates between the ATP- and ADP-state. (B) Non-equilibrium dissociation constant as a function of the hydrolysis acceleration ratio and of the stoichiometric ratio between the total substrate and Hsp70 concentrations. The color codes are the same as in Figure 2, green for the region accessible in equilibrium, and red-to-yellow for the region accessible in non-equilibrium. The blue line is the non-equilibrium dissociation constant reported in Figure 2B.

