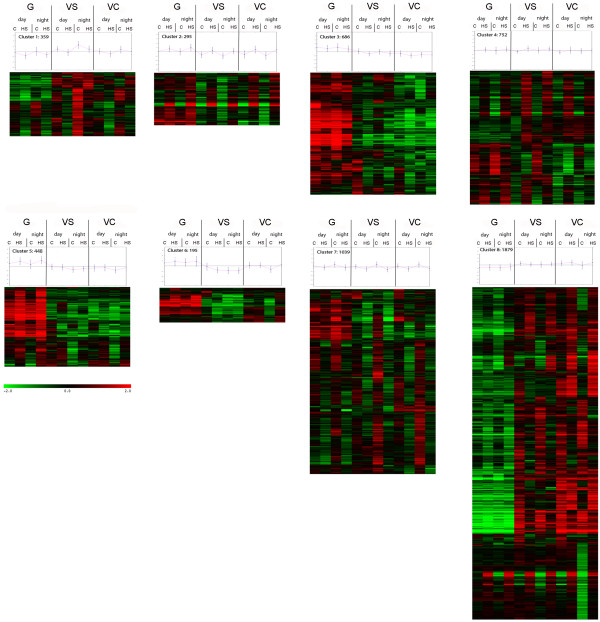
Figure 4.
Cluster with their centroid graphs identified by hierarchical clustering on averaged and mean centered expression values of all modulated transcripts. Stages are ordered according to developmental stage form the left: G (Green), VS (VéraisonSugar), VC (VéraisonColor), day and night and Control (C) and Heat Stress (HS).

