Figure 5.
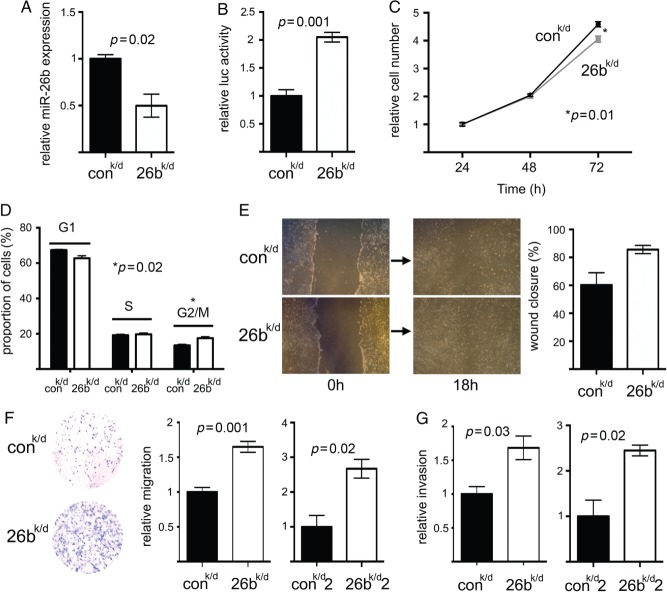
Stable down-regulation of miR-26b in breast fibroblasts inhibited growth but stimulated both migration and invasion. Immortalized breast fibroblasts were stably transduced to knock down miR-26b (26k/d) or with a control construct (conk/d). (A) MiR-26b expression was quantified in the two cell lines using qPCR (relative to RNU6B). Data are means of technical triplicates (± standard error) and are representative of duplicate experiments. (B) MiR-26b function was assessed as ratios of firefly to Renilla luciferase expression using a miR-26b target luciferase reporter (containing a perfect miR-26b binding site downstream of firefly luciferase and also coding for Renilla luciferase as an internal control). Cell lines were transfected with the reporter and dual luciferase assays were performed after 24 h. (C) Cell growth in the two cell lines was monitored using MTT assays over 72 h after initial seeding of equal numbers of cells. (D) Proportions of cells in G1, S, and G2/M phases of the cell cycle were determined in sub-confluent cultures using propidium iodide staining and flow cytometry. (E) Migration was determined in scratch-closure assays using digital imaging as the percentage scratch area remaining 18 h after scratch formation. Representative images are shown immediately after forming the scratch and at 18 h. (F) Migration was determined in trans-well assays by manual counting of cells that had passed through the membrane. A representative example of the trans-well migration result is shown. A second independent breast fibroblast line was also stably transduced (26k/d2 and conk/d2). Cells having migrated through the membranes were counted at 12 h for 26k/d and conk/d and at 24 h for 26k/d2 and conk/d2 (the second pair of transduced fibroblast lines migrated/invaded more slowly, reflecting variation between individual parental fibroblasts). (G) Invasion was assessed using trans-well assays by manual counting (at the same time points as F). Data in B–G are means of biological triplicates (± standard error) and are representative of duplicate (B, D–G) or triplicate (C) experiments.

