
Figure 1.
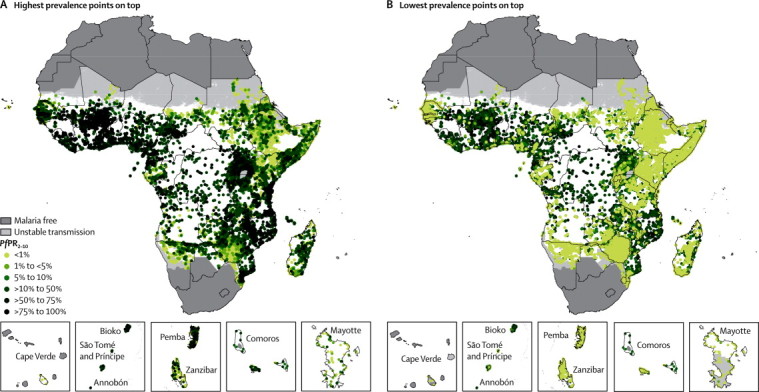
Distribution of 26 746 community Plasmodium falciparum parasite rate space–time survey datapoints in Africa for the period 1980–2012
(A) Highest prevalence points on top and (B) lowest prevalence points on top. The dark grey, light grey, and white areas are malaria free and the limits of unstable and stable transmission, respectively, for the year 2000 in Africa. PfPR2–10=community Plasmodium falciparum parasite rate standardised to the age group 2–10 years.