
Figure 4.
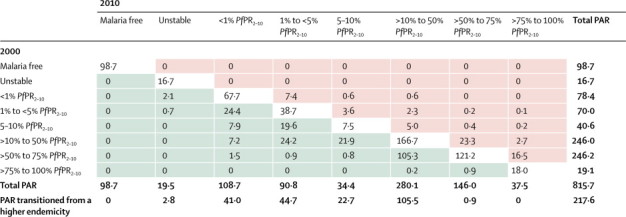
The 2010 population (millions) in malaria-endemic countries in Africa by their Plasmodium falciparum parasite rate endemicity class in 2000 and 2010
The green shaded cells show the number of people (millions) in 2010 who lived in areas where malaria endemicity had reduced by at least one level from that of 2000. The pink shaded areas are those where endemicity had increased by at least one level from that of 2000. These estimates do not include Burundi, Central African Republic, Congo, Mauritania, and Niger, for which we did not have sufficient data to predict change. PAR=populations at risk. PfPR2–10=community Plasmodium falciparum parasite rate standardised to the age group 2–10 years.