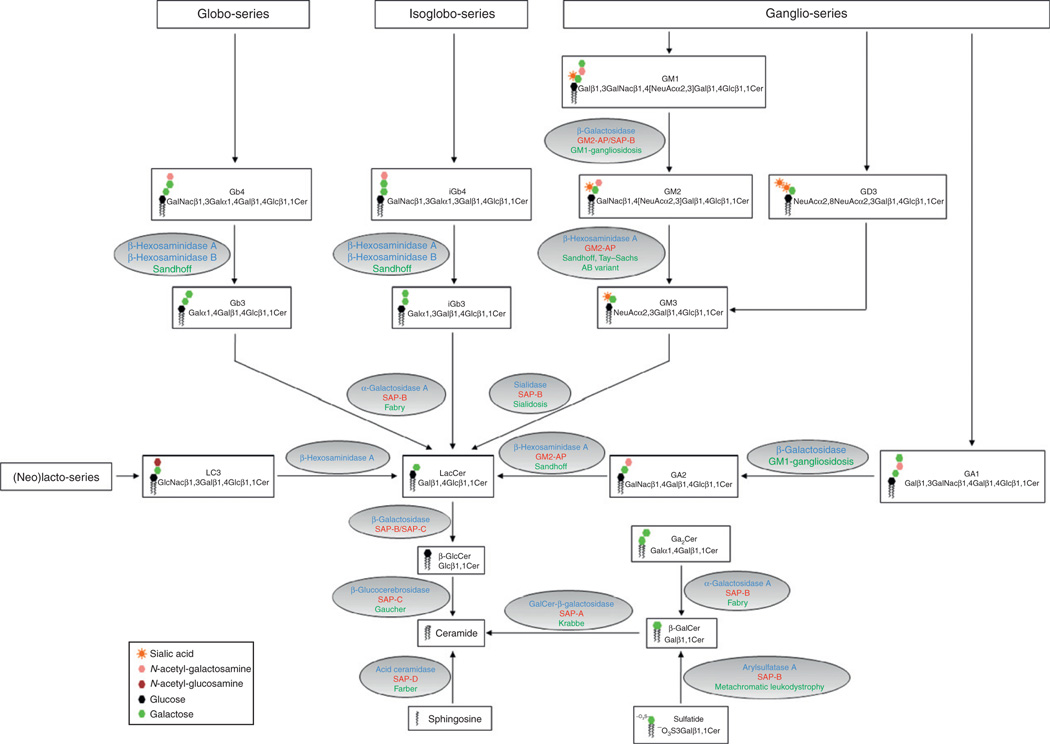
Figure 2.1.
Pathways of GSL degradation. The graph depicts the degradative pathways of various GSL species, including the globo-, isoglobo-, ganglio-, and (neo)lacto-series. The names, formula, and structural icons of the respective GSLs are shown in the boxes. The ovals contain the enzymes (depicted in blue) and the saposins (shown in red) that are involved in the corresponding lipid degradation step. The associated lysosomal storage disease due to enzyme or saposin deficiency or both is indicated in green.

