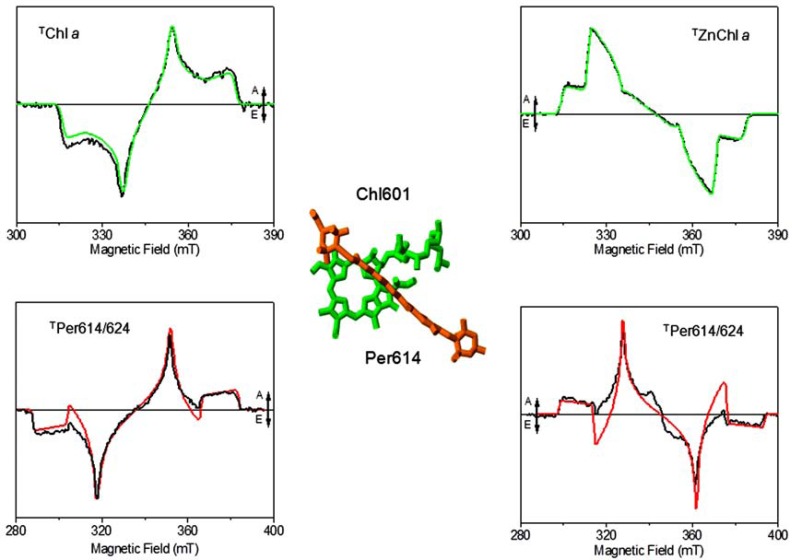
Fig. (6).
Left column from top to bottom: Powder TR-EPR spectrum of Chl a in 2Me-THF glass with relative simulation. Comparison between the calculated EPR spectrum of Per614/624 in MFPCP with the experimental powder TR-EPR spectrum of MFPCP. Right column from top to bottom: powder TR-EPR spectrum of Zn-Chl a in 2Me-THF glass with relative simulation. Comparison between the calculated EPR spectrum of Per614/624 with the experimental powder TR-EPR spectrum of ZnChl a-RFPCP. The geometrical arrangement of Chl a/Per614 pair the crystal structure of each couple is also reported. A = absorption, E = emission. The figure is based on the data from [97, 98], experimental conditions and simulation parameters reported therein.

