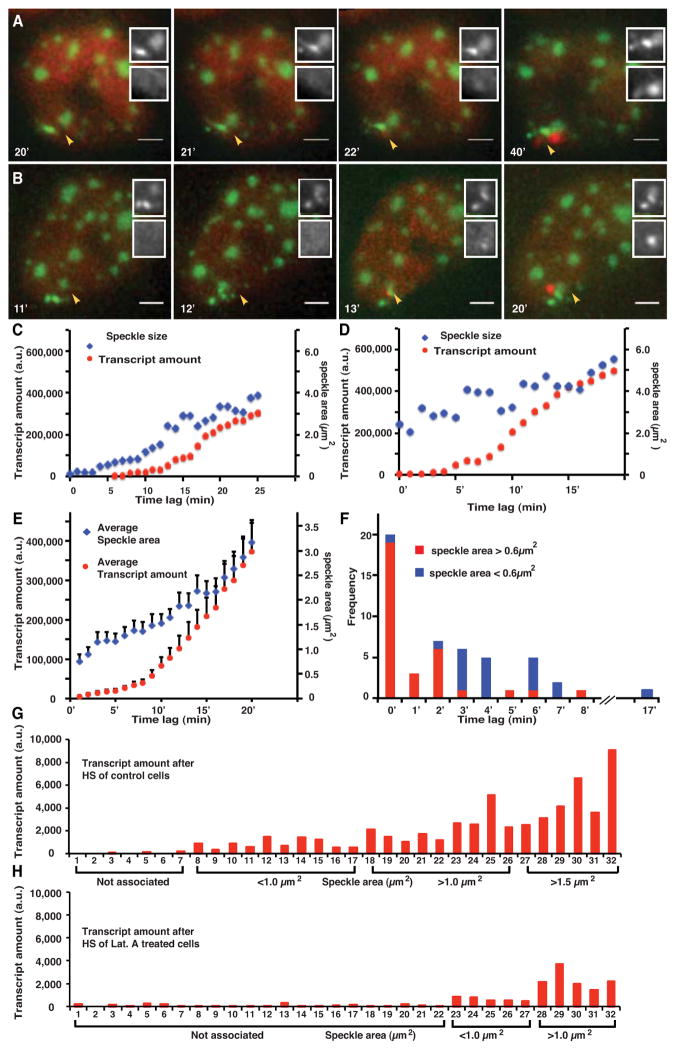
Figure 4. Hsp70 transgene transcription is facilitated by nuclear speckle association.
(A–B) Transcript signal (mCherry-MS2-binding protein, red) increases above background levels shortly after first contact of transgene array (bright green) with nuclear speckle (lighter green). Top inset- green channel; Bottom inset- red channel. Time is min after heat shock. Scale bar= 2 μm. (C–D) Two examples of speckle area (blue) plotted versus integrated MS2-binding protein signal (red, “transcript amount”) in arbitrary units (a.u.) as function of time after initial transgene contact with a nuclear speckle. (E) Speckle size versus transcript signal as function of time after speckle first contact averaged over all observations. (F) Histograms for the delay between first contact with speckle and appearance of transcript signal plotted for transgene arrays that contact small speckles (< 0.6 μm2, blue) versus large speckles (>0.6 μm2, red). Speckle size is measured at time of first contact. (G–H) Integrated transcript signals from each of 32 different cells (x-axis) 30 min after heat shock ordered by increasing speckle size. Low transcript levels are observed for transgene arrays not associated with nuclear speckles. A much larger fraction of transgenes arrays were not associated with nuclear speckles after latrunculin A treatment (H) as compared to control cells (G). Speckle associated transgene arrays show comparable transcript levels between control (G) and latrunculin A treated cells (H) if transgene arrays are grouped according to the size of their associated nuclear speckles. See also Movie S6.

