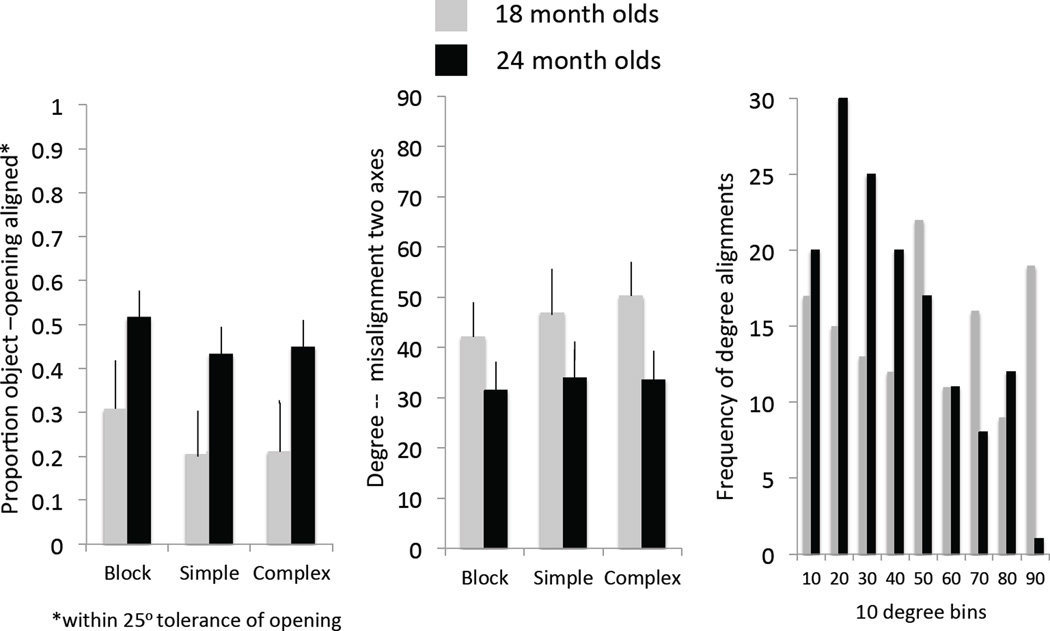
Figure 5.
Three measures of performance in Experiment 1 as a function of age group. Left: Proportion of trials on which the axis of elongation of the object and the rectangular slot were aligned (within the 25° tolerance of the opening) on initial approach (just prior to insertion). Center: Mean degree of measured alignment of the elongated axis of the object and the slot. The standard error of the mean is provided for both measures. Right: Histogram of all insertions within 10° bins (bins labeled by the maximum angle included) across all participants and stimuli for 18 month olds and for 24 month olds.

