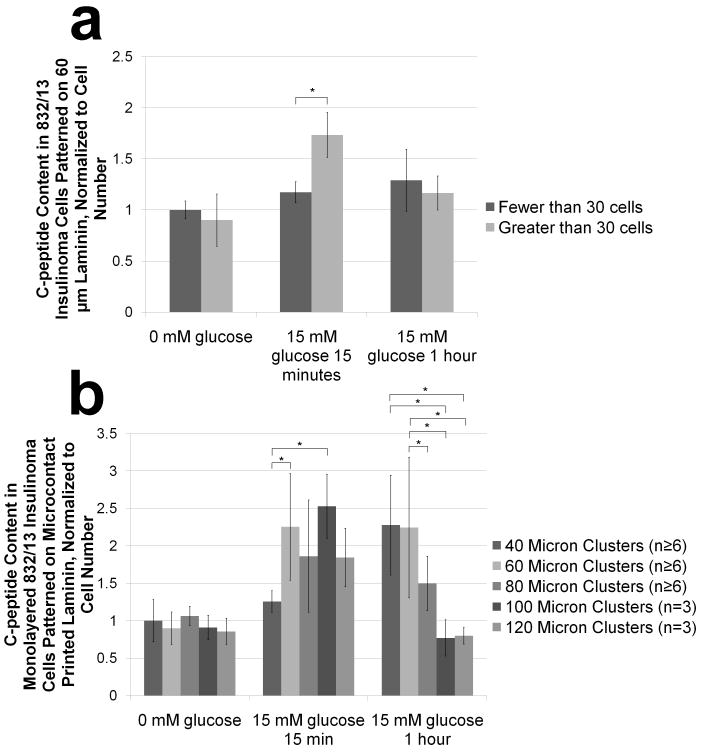
Figure 3. Semi-quantitative immunocytochemistry reveals effects of cluster size on normalized c-peptide content under different glucose conditions.
832/13 insulinoma cell clusters are fixed, permeabilized and stained for c-peptide, F-actin and nuclei before, 15 minutes after, and 1 hour after glucose stimulation. Confocal images are acquired and total intensity of c-peptide staining is normalized to the nuclear stain intensity which correlates linearly with the number of nuclei (Supplementary Figure 4). (a) Quantified normalized c-peptide intensity was then determined between monolayered and multilayered clusters for each glucose condition (data is normalized to the average of monolayered clusters before glucose stimulation). (b) Normalized c-peptide intensity is also evaluated between monolayered clusters on a single coverslip containing 40, 60, 80, 100 and 120 μm are compared to each other for each glucose condition (data is normalized to the average of the 40 μm clusters before glucose stimulation). Data is presented as an average ± standard deviation. Statistical significance is indicated with an * and was established using the Student-Newman-Keuls Test with a α=.05 after performing an ANOVA.

