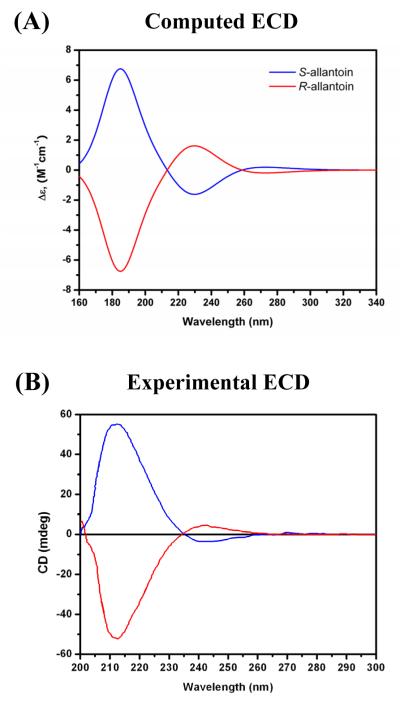
Figure 3.
(A) Calculated ECD of S and R-allantoin enantiomers (B) Experimental ECD spectra of S-allantoin (blue) and R-allantoin (red). The experimental ECD spectra were adapted from Figure 2A of Ramazzina et al (34), with the gracious permission of Prof. Riccardo Percudani. These ECD data were obtained using (S)-allantoin (0.2 mM) or (R,S)-allantoin (0.4 mM) as substrates in the presence of PuuE (0.37 μM) in1ml of 0.1 M potassium phosphate, pH 7.6.

